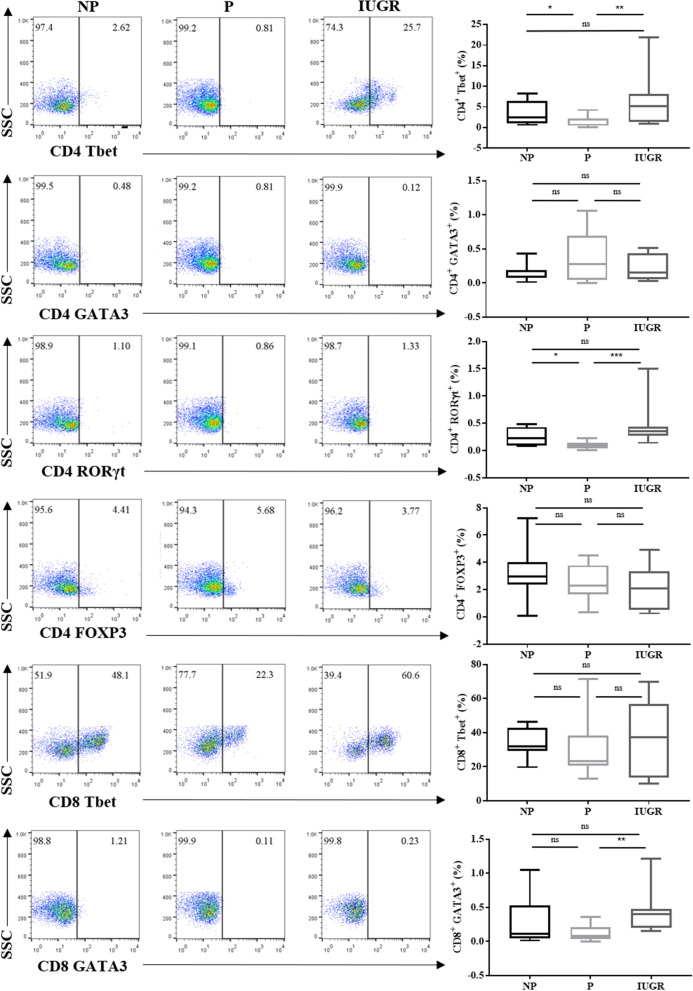
Figure 2.
Tbet and RORγt is decreased in CD4+ T-cells during normal pregnancy compared IUGR. Representative flow cytometry dot plots of transcription factor expression in CD4+ Tbet (Th1), GATA3 (Th2), RORγt (Th17), FOXP3 (Treg) and CD8+ Tbet (Tc1), and CD8+ GATA3 (Tc2) T-cells from NP (n = 12), P (n = 12) and IUGR (n = 8). Box and whisker plots indicate median and IQR of T-cells expressing transcription factors. *p < 0.05, p** < 0.01, ns = non- significant, determined by Kruskal–Wallis with Dunn’s multiple comparisons test. Flow cytometry data were analysed using the FlowJo Software Version 10 (Becton Dickinson); website: https://www.flowjo.com/.

