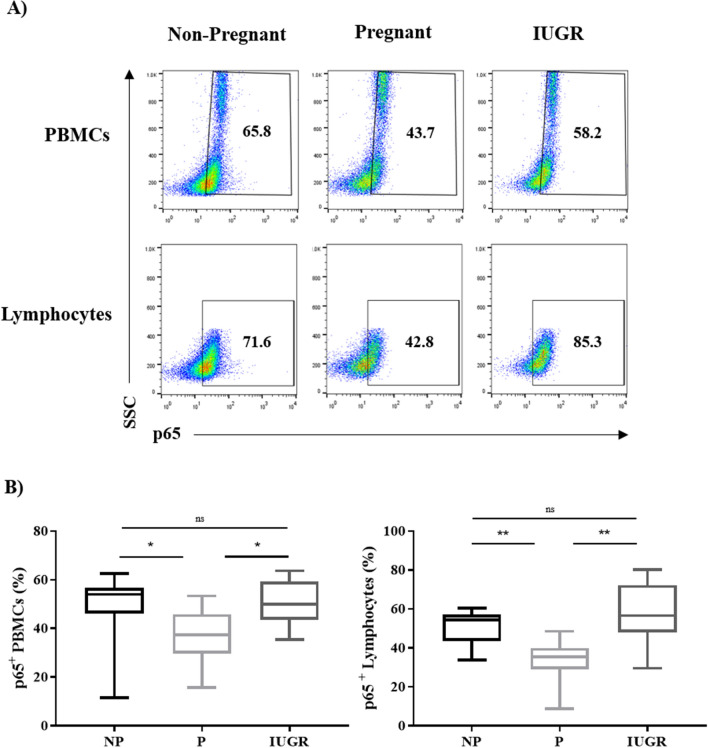
Figure 3.
Expression of p65 in PBMCs and lymphocytes is reduced during normal pregnancy and increased during IUGR. (A) Representative flow cytometry dot plots of PBMCs and lymphocytes expressing p65 from NP (n = 11), P (n = 12) and IUGR women (n = 8). (B) Box and whisker plots indicate median and IQR of percentage of PBMCs and lymphocytes expressing p65. *p < 0.05, **p < 0.01, ns = non-significant, determined by Kruskal–Wallis with Dunn’s multiple comparisons test. Flow cytometry data were analysed using the FlowJo Software Version 10 (Becton Dickinson); website: https://www.flowjo.com/.

