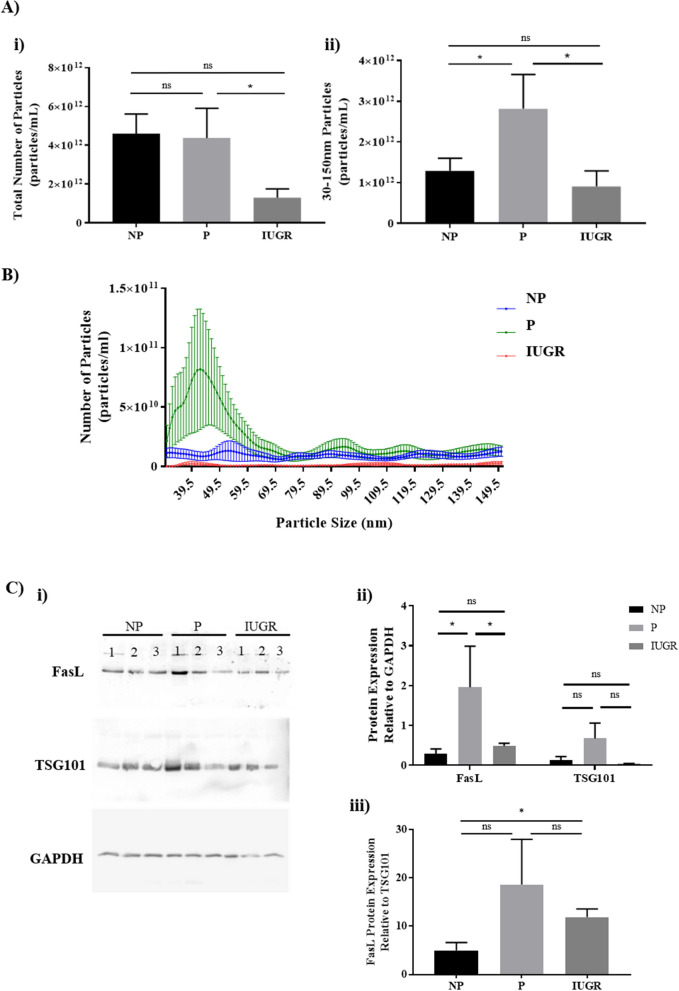
Figure 6.
Particle concentration from plasma is reduced during IUGR compared to normal pregnancies. Nanoparticle tracking analysis (NTA) was used to quantify EVs present in plasma of NP, P, IUGR (all n = 8). (A) Bar graphs represent the median and IQR of total number of particles, and particles between 30–150 nm. (B) Line graph represents the mean ± SEM of the particles between 30–150 nm exosomes. Profile for NP (▬), P(▬) and IUGR (▬) plasma is shown. *p < 0.05, determined by Kruskal–Wallis with Dunn’s multiple comparisons test. (C) EVs isolated from pregnant plasma were characterised by exosomal marker TSG101, and FasL expression in NP, P and IUGR samples. (i) Blots are representative of 3 patients per cohort. Full length blots are presented in Supplementary Fig. 3, where gel edges that are not evident in the uncropped GAPDH gel are indicated by the digital image of the gel. (ii) Bars indicate median and IQR of densitometric analysis of FasL and TSG101 protein expression as a fold change relative to house keeping protein GAPDH from 4 patients per cohort. (iii) Bars indicate median and IQR of densitometric analysis of FasL protein expression as a fold change relative to TSG101 from 4 patients per cohort. *p < 0.05, ns = non-significant, determined by Mann–Whitney due to a small sample size. Densitometry of western blots was performed using the Image-J digital software version 1.8.0; website: https://imagej.nih.gov/ij/. Particle concentration and size distribution were automatically analysed with the NanoSight NTA Software Version 3.2 (Malvern Instruments, UK).

