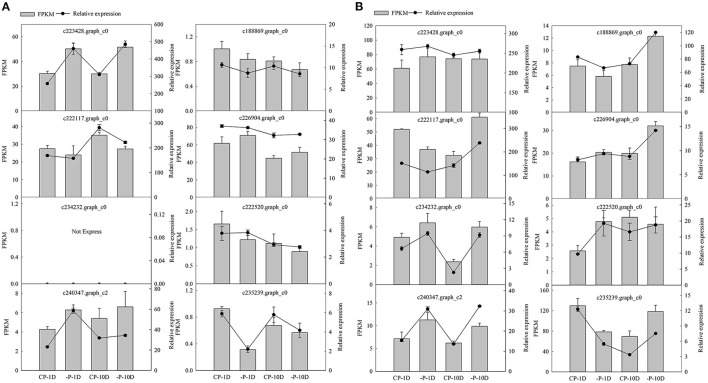
Figure 8.
Quantitative reverse-transcription PCR validation of DEGs in shoots and roots. (A,B) Represent expression levels of eight DEGs based on RNA-seq and qRT-PCR in the shoots and roots, respectively. Black columns represent FPKM based on the Illumina platform. Lines represent relative expression quantity tested by qRT-PCR. The bars represent SE (n = 3).

