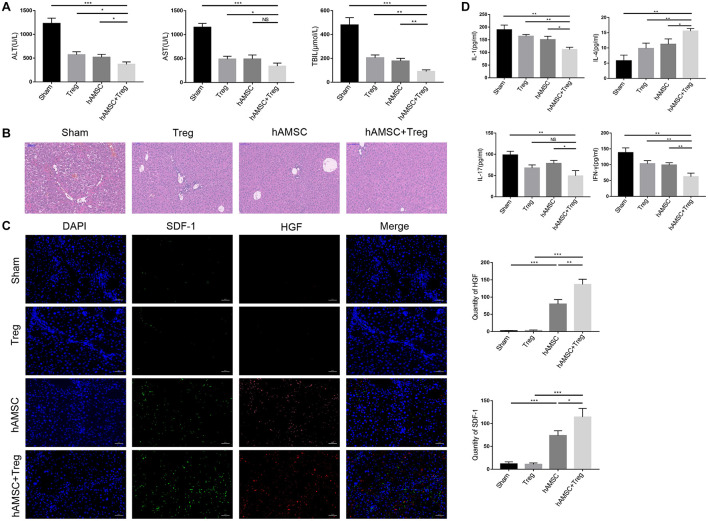
FIGURE 1.
PBS, Treg, hAMSC, and hAMSC + Treg were injected into mice through the tail vein, respectively. (A) Level of ALT, AST, and TBIL of four groups. (B) Representative images of liver tissue [hematoxylin and eosin (HE) staining] by light microscopy in four groups. (C) Representative fluorescent images for SDF-1 and HGF in four groups were visualized by fluorescence microscopy, and DAPI was used to mark nuclei. (D) Level of IL-1, IL-4, IL-17, and IFN-γ in sham group, Treg group, hAMSC group, and cotransfer group. The result is representative of three independent experiments. Data were mean ± SD of three independent experiments. * p < 0.05, ** p < 0.01, *** p < 0.001.

