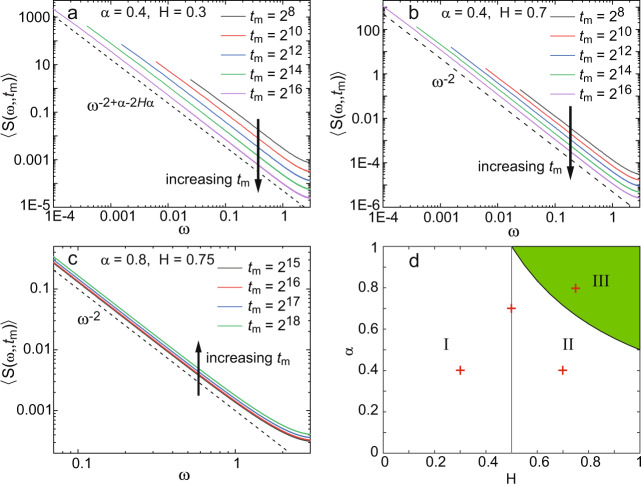
Fig. 3. Power spectral density of numerical simulations of fBM with heavy-tailed immobilization times.
a Simulations for five different measurement times with α = 0.4 and H = 0.3. The number of realizations is N = 10,000. Given that the fBM is subdiffusive (H < 1/2), the PSD is predicted to scale as as in Eq. (13). The dashed line shows the scaling ω−2+α−2αH and the arrow indicates the decay in the PSD as the measurement time tm increases. b Simulations for five different measurement times with α = 0.4 and H = 0.7, N = 10,000 realizations. The fBM is superdiffusive (H > 1/2) and the PSD is, thus, predicted to scale as (Eq. (14)). The dashed line shows the scaling ω−2 and the arrow shows the decay in the PSD with measurement time tm. c Simulations for five different measurement times with α = 0.8 and H = 0.75, N = 5,000 realizations. Given that 2αH > 1, the power spectrum increases with measurement time as indicated by the arrow. The dashed black line indicates ω−2. d The shaded region (regime III) indicates the set of values for α and H that yields a PSD 〈S(ω, tm)〉 that increases with measurement time. In the rest of the plane, the power spectrum decays with tm. Within this part of the plane, regime I is characterized by and regime II by . The red crosses indicate the pairs (H, α) used in the examples in a–c, and the CTRW in Fig. 2.

