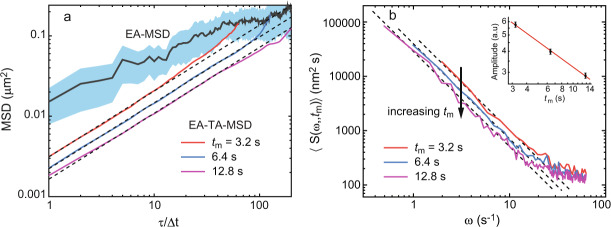
Fig. 4. Analysis of Nav1.6 experimental trajectories in the soma of hippocampal neurons.
a The time-averaged MSD is different from the ensemble-averaged MSD (gray upper line). The shaded region indicates the 95% confidence interval for the ensemble-averaged MSD. The time-averaged MSD scales with the lag time as τ0.81±0.05 (dashed lines), while exhibiting aging as it decays with experimental time as , from which α is estimated to be 0.54 ± 0.02. b Average spectra are presented for three measurement times. The dashed lines show a scaling 1/ω1.75. Besides the power-law scaling, the spectra exhibit white noise evident at large frequencies, likely due to localization error. The arrow shows the decay in the PSD with measurement time tm. The inset shows the amplitude of the PSD as a function of measurement time in a log-log plot. It shows that the spectrum exhibits aging with a power law scaling , from which α is estimated to be 0.50 ± 0.02. The combined measurements provide four different ways to determine the two relevant parameters, indicating the consistency of the model.

