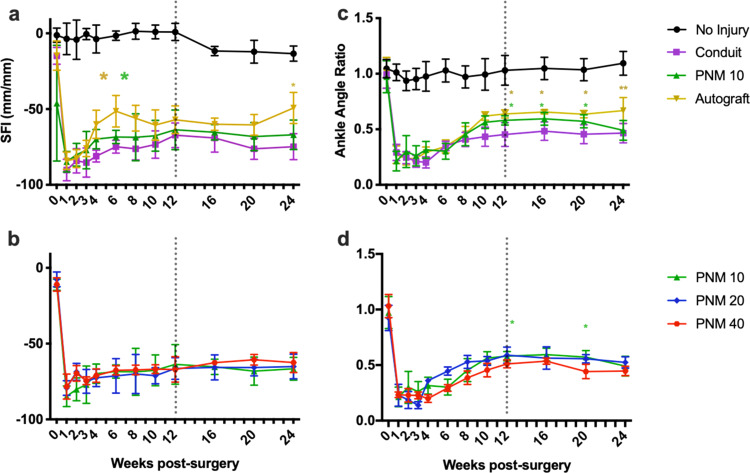
Fig. 4. Gait analysis via SFI and ankle angle measurements in experimental and NI groups normalized by their contralateral hind limb values.
Vertical dotted line placed at the threshold for the piecewise statistical approach described in the methods section. a SFI over 24 weeks. Gold asterisks denote significance between autograft and PNM-10 and green asterisks denote significance between PNM-10 and conduit. b Ankle angle over 24 weeks. c SFI over 24 weeks for PNM groups. Gold asterisks represent significance when comparing autograft to PNM-10 and green asterisks represent significance when comparing PNM-10 to the conduit. d Ankle angle over 24 weeks for PNM groups. A green asterisk compares PNM-10 with PNM-40. P values <0.05 are denoted by *, p < 0.01 by **, p < 0.001 by ***, and p < 0.0001 by ****.

