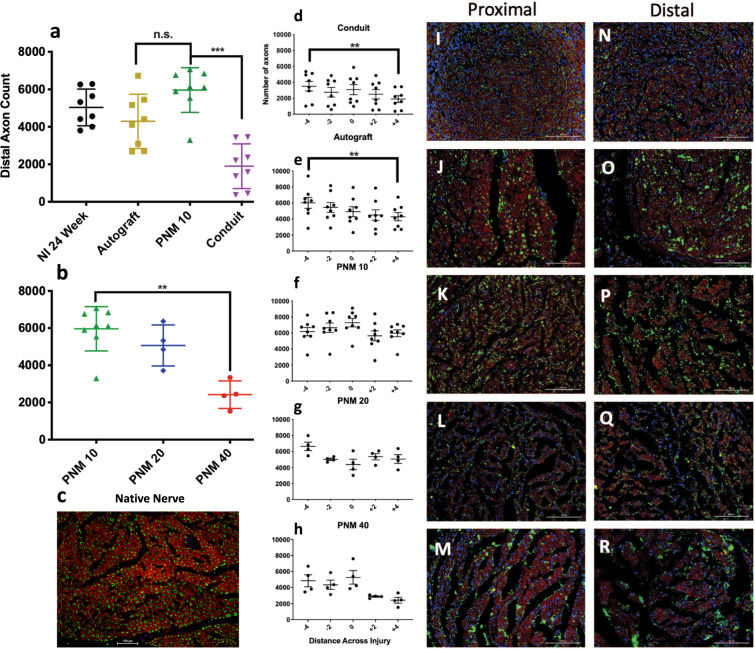
Fig. 6. Axon quantification and qualitative morphological appearance.
a Axon counts for each group. b Comparisons of axon counts between concentrations of PNM. C Representative cross-section of a native, non-injured rat sciatic nerve at ×20 magnification. Scale bar 100 µm, neurofilament heavy chain for axons tagged in green, fluoromyelin for myelin in red, and DAPI for nuclei in blue. d–h Longitudinal distributions of axon count for each group. i–m Representative sections at the proximal (−4 mm) and n–r distal (+4 mm) locations of the gap defect. The scale bar represents 100 μm and images were taken at ×20 magnification. Axons appear in green, myelin in red, and nuclei in blue. Data are presented as mean ± SD. P values <0.05 are denoted by *, p < 0.01 by **, p < 0.001 by ***, and p < 0.0001 by ****.

