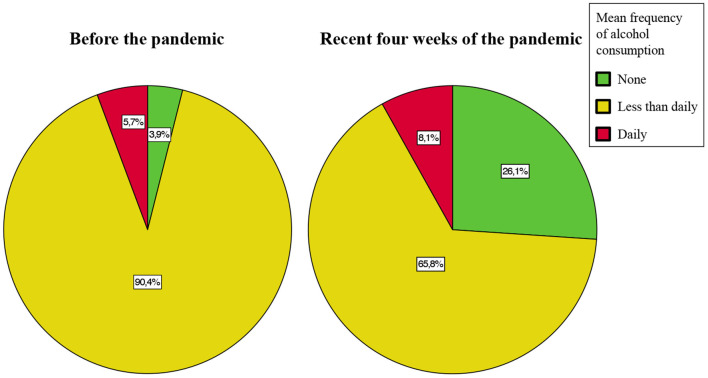
Figure 1.
Mean frequency of alcohol consumption during the early COVID-19 pandemic. The pie charts illustrate the mean frequency of alcohol consumption before the pandemic (left) and during the recent 4 weeks of the pandemic (right). Compared to before pandemic, the mean frequency of alcohol consumption decreased during the recent 4 weeks of pandemic. The percentages indicate the proportion of individuals from the sample excl. n = 2 individuals did not report mean frequency of alcohol consumption, i.e., this figure includes data from n = 3,319 individuals. Absolute number are reported in the Supplement 1.

