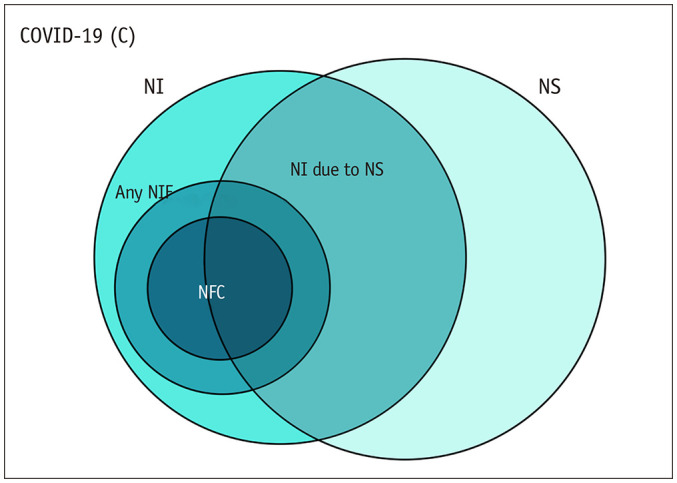
Fig. 1. Venn diagram illustrating the cohort-based outcomes used in this study.

1) proportion of patients with NS among all COVID-19 patients (NS/C); 2) proportion of patients with NI among patients with NI-NS; 3) proportion of patients who underwent NI among all patients assessed (NI/C); 4) proportion of patients with any NI findings among the patients who underwent NI (NF/NI); 5) proportion of patients with NFC among the patients who underwent NI (NFC/NI); 6) proportion of patients with NFC among all patients assessed (NFC/C). COVID-19 = coronavirus disease 2019, NF = NI findings, NFC = NF related to COVID-19, NI = neuroimaging, NS = neurologic symptoms
