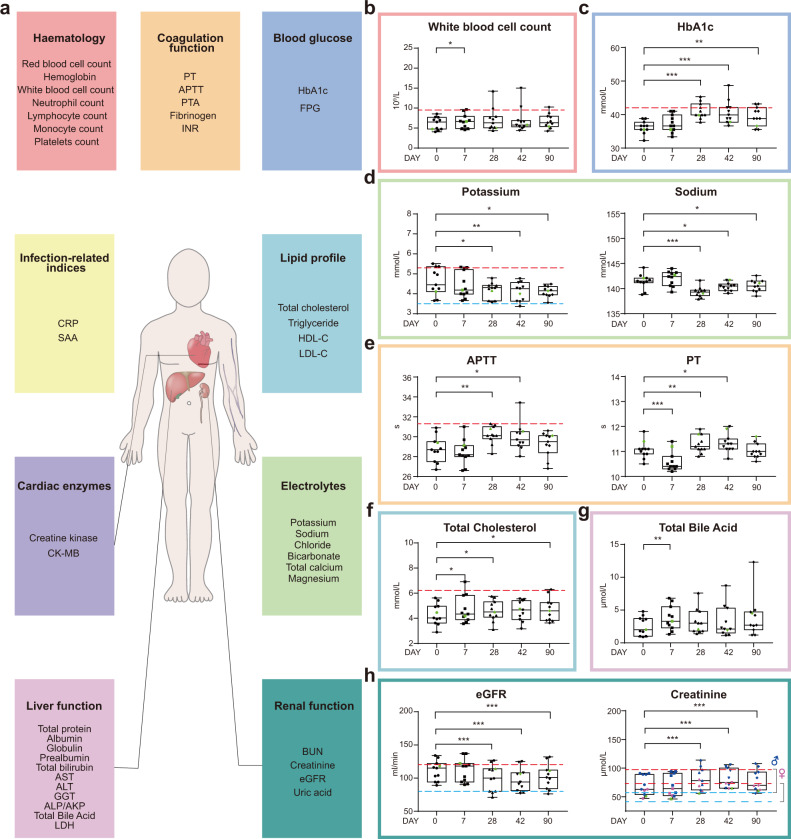
Fig. 2. Temporal changes of clinical laboratory measurements after vaccination.
a Clinical laboratory routine tests include hematologic and coagulation parameters, blood glucose-related and infection-related indices, lipid profile, cardiac enzymes, electrolytes, liver- and renal function-related biomarkers. More information could be found in Supplementary Tables S4 and S5. Laboratory test values of white blood cell count (b), HbA1c (c), potassium (d, left panel), sodium (d, right panel), APTT (e, left panel), PT (e, right panel), total cholesterol (f), total bile acid (g), eGFR (h, left panel), creatinine (h, right panel). Data points represent the values of each individual. Box plots showed the 25th, 50th (median), and 75th percentiles. Horizontal dashed lines showed upper normal limits (red) in b, c, d (left panels), e (left panel), f, h and the lower normal limits (blue) in d (left panel) and h. The P values were calculated by the Wilcoxon sign-rank test by comparing the laboratory measurements at each time with the baseline measurements. *P ≤ 0.05, **P ≤ 0.01, ***P ≤ 0.001.

