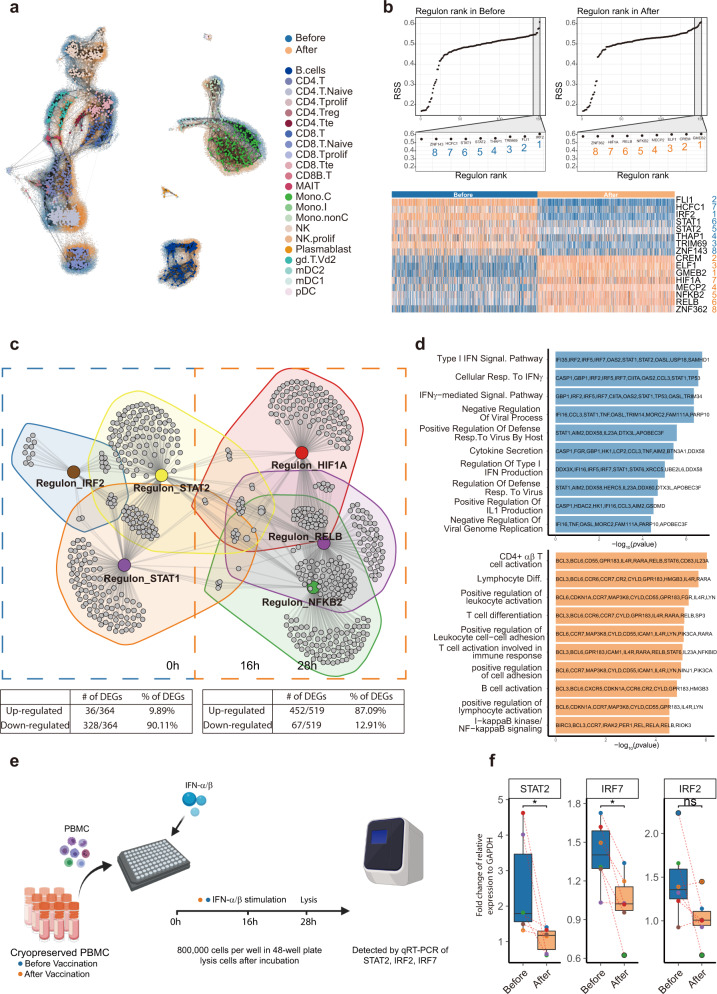
Fig. 5. Identification of master regulons and their regulatory networks before and after vaccination.
a Visualization for the “similarity-structure-associating” metacells on the original scRNA-seq data. Metacells were color-coded according to their cell-type annotations. The original scRNA-seq data were color-coded “blue” and “orange” to represent samples “before” and “after” vaccination, respectively. b Top panels: rank of regulons in samples before (left) and after (right) vaccination, based on Regulon Specificity Score (RSS). Bottom panels: heatmap of top-ranked regulon activities before (blue) and after (orange) vaccination based on AUCell scores. Names of the regulons are color (blue/orange) and number coded (1–8). c Network of regulons and their target genes. The table below indicated the proportion of genes within the regulons which were up- or downregulated after vaccination. d Gene functional annotation and related genes before (blue) and after (orange) vaccination. e Schematic overview of the experiment. f After treatment with IFN-α/β, PBMCs from volunteers after vaccination had reduced expression of genes associated with type I interferon responses as compared to those before vaccination. Paired Wilcoxon test was used. *P ≤ 0.05, n = 6.

