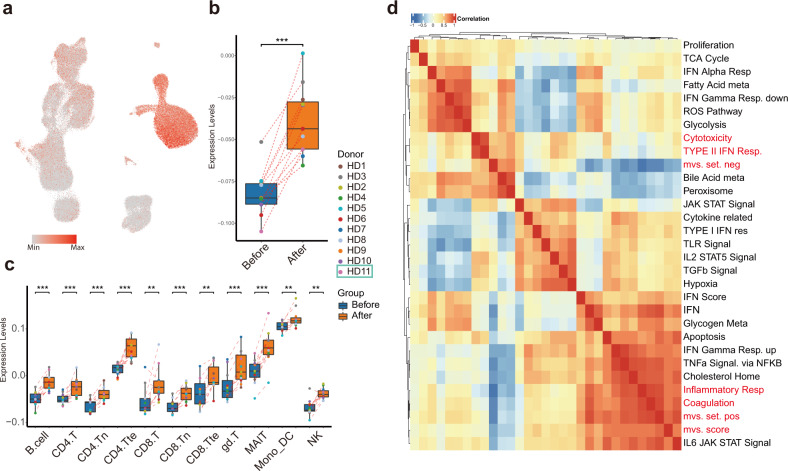
Fig. 6. Monocytes displayed high MVS scores and MVS score-correlated pathways.
a UMAP visualization colored by MVS scores. b MVS scores in pseudo-bulk samples combining all cell types showed upregulation after vaccination. c Box plots depicting the score distribution amongst 11 major immune cell types before and after vaccination. d Heatmap of correlation between MVS scores and enriched pathways of differentially expressed genes before and after vaccination.

