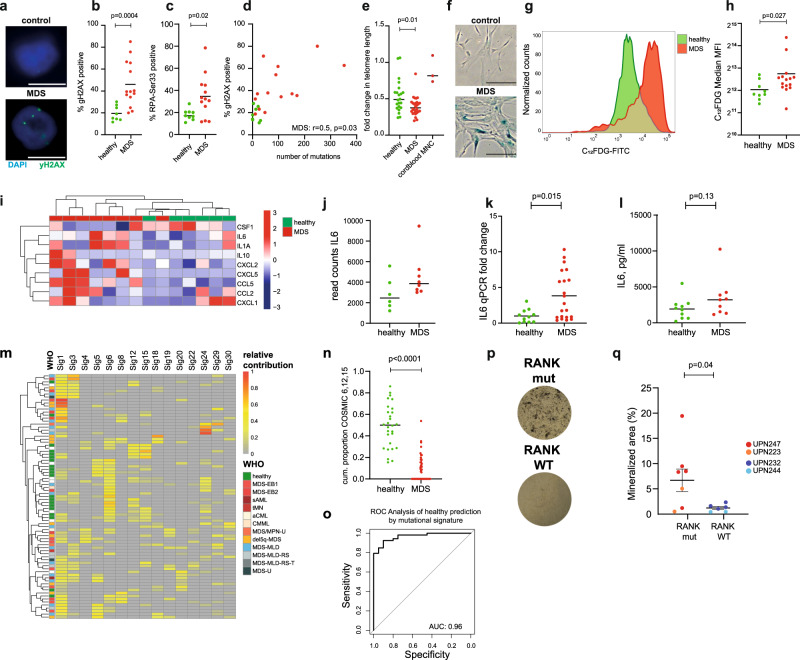
Fig. 3. Phenotypic differences in mutated MSCs.
a Representative immunofluorescence images from MDS and control MSCs upon γH2AX staining. DAPI in blue, γH2AX antibody in green, scale bar represents 10 µm. b, c Quantification of γH2AX and RPA foci in at least 50 cells analyzed per sample, two-sided Mann–Whitney test. Data are presented as mean and individual values. d Correlation of γH2AX foci and number of mutations in exome sequencing. Pearson r, two-sided p value. e Quantification of the relative difference in telomere length in MDS and control MSCs using qPCR to interrogate n = 28 MDS, n = 22 healthy, and n = 3 cord blood, biologically independent mononuclear cell (MNC) samples, two-sided Mann–Whitney test. Data are presented as mean and individual values. f, g Representative β-galactosidase staining, and flow cytometry result of C12FDG, a fluorogenic substrate of β-galactosidase. scale bar represents 100 µm. h Quantification of C12FDG mean fluorescence intensity (MFI) for MDS and control MSCs, two-sided Mann–Whitney test. Data are presented as mean and individual values. i Gene expression heatmap of genes associated with the inflammatory senescence-associated secretory phenotype (SASP) derived from RNA sequencing. j RNA Sequencing read counts for IL6 in expanded MSCs. Data are presented as mean and individual values. k, l qPCR and ELISA validation of IL6 expression in a cohort or n = 32 MDS- and 19 healthy MSCs, two-sided Mann–Whitney test. Data are presented as mean and individual values. m COSMIC mutational signatures in MSC samples with >20 mutations for signatures and more than a total 10% occurrence in the cohort. Relative contribution is color-coded. Sig: COSMIC Signature. n Cumulative (cum.) proportion of COSMIC signatures 6, 12, and 15 per group, two-sided Mann–Whitney test. Data are presented as median and individual values. o Receiver operating curve (ROC) for classification of MDS and healthy according to COSMIC signatures 6, 12, and 15. AUC area under the curve. p, q Quantification of ossification as quantified by von Kossa-Staining upon a 21d osteogenic differentiation protocol of MDS-MSCs with or without RANK mutation, each dot represents an independent differentiated aliquot. two-sided Mann–Whitney test. Data are presented as mean and individual values, error bars represent SEM. Mutations were confirmed in differentiated osteoblasts by Sanger sequencing. Source data are provided as a Source Data file.

