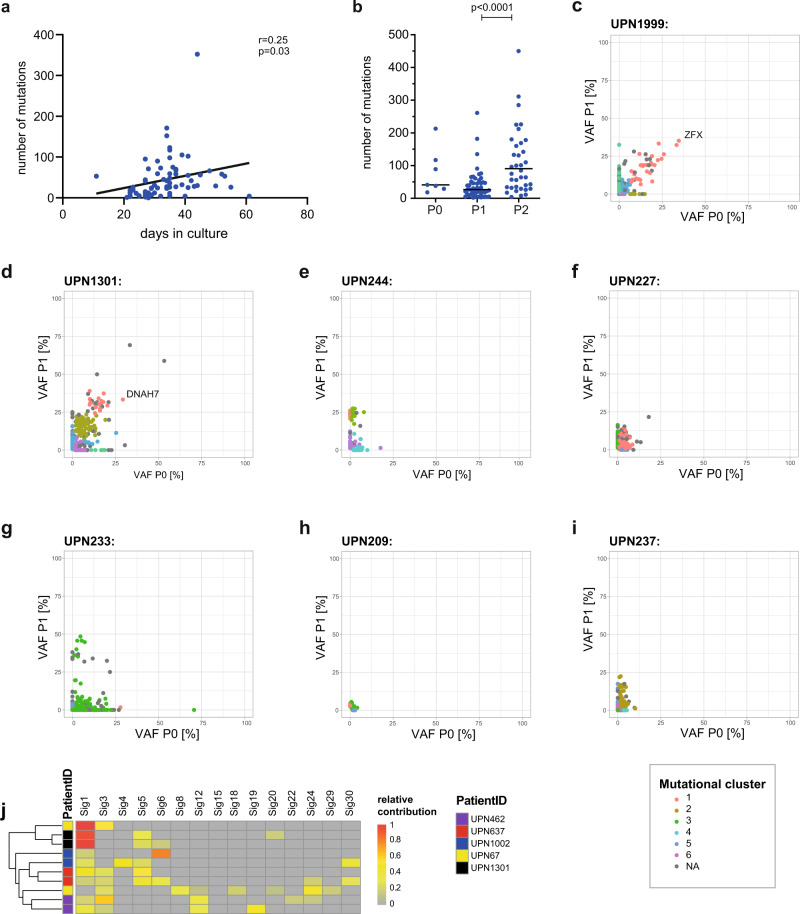
Fig. 4. Time series analysis of mutations during culture.
a Spearman correlation of the total number of mutations associated with the time from seeding to harvest. b Total number of mutations in dependency of the culture passage, n = 7 (P0), n = 48 (P1), and n = 38 (P2) biologically independent samples, two-sided Mann–Whitey test, P = passage. Data are presented as median and individual values. c–i VAFs of individual mutations obtained from two different passages of the same culture derived from exome sequencing of n = 7 MDS cases. Color-coded mutational clusters were calculated with the sciclone tool37. j Extracted mutational COSMIC signatures for n = 5 patient sample pairs upon exome sequencing from 2 independent bone marrow aspirations. Patient IDs are color-coded. Source data are provided as a Source Data file.

