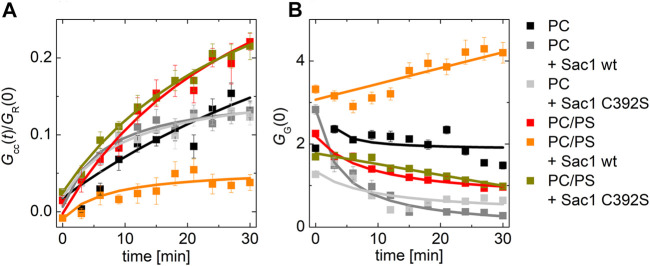
FIGURE 3.
PI4P transport followed by Sac1 dephosphorylation viewed by FCCS. (A) The temporal evolution of the transport-monitoring parameter G cc/G R and (B) the temporal evolution of the amplitude of the CFP autocorrelation function, and the parameter reporting on the biosensor binding G G. The PI4P-accepting membrane was composed of POPC and the following: i) not decorated by Sac1 (black squares), ii) decorated by Sac1 wt (dark gray squares), and iii) decorated by Sac1 C392S (light gray squares). The PI4P-accepting membrane was composed of POPC/PS (20 mol% of PS) and the following: i) not decorated by Sac1 (red squares), ii) decorated by Sac1 wt (orange squares), and iii) decorated by Sac1 C392S (dark yellow squares). The error bars stand for the standard deviation. The presented data represent the trends that were observed in minimum three independent experiments.

