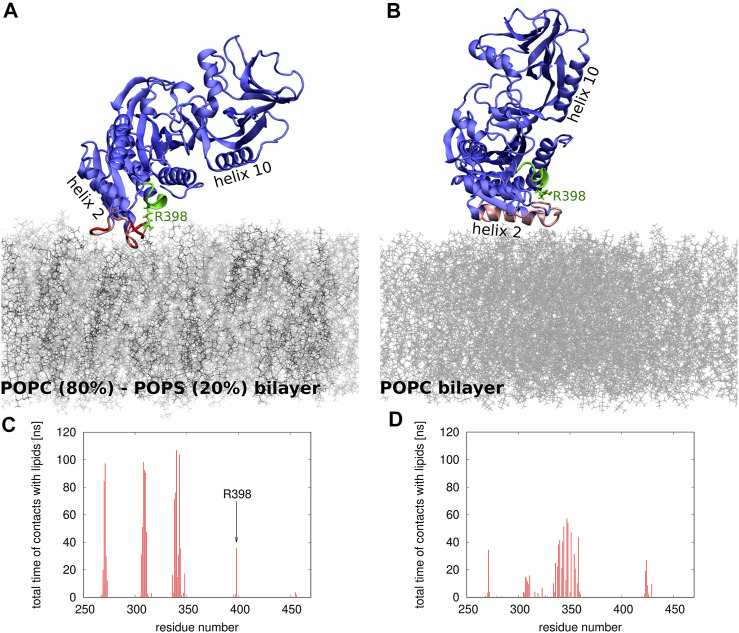
FIGURE 5.
(A,B) Snapshots from the MD simulations of Sac1 at (A) POPC-POPS and (B) POPC bilayer. The POPC and POPS molecules are shown as thin sticks in gray and black, respectively. The Sac1 molecule is shown in blue except for the regions that make strong (shown in red) or transient (shown in pink) contacts with lipids. The catalytic P-loop is shown in green. Helices 2 and 10 are indicated to show the differences in how Sac1 is oriented relative to (A) POPC-POPS and (B) POPC bilayers. Arg 398 is shown in stick representation. (C,D) Histograms showing which amino acid residues and how frequently make contacts with (C) POPC-POPC and (D) POPS bilayers.

