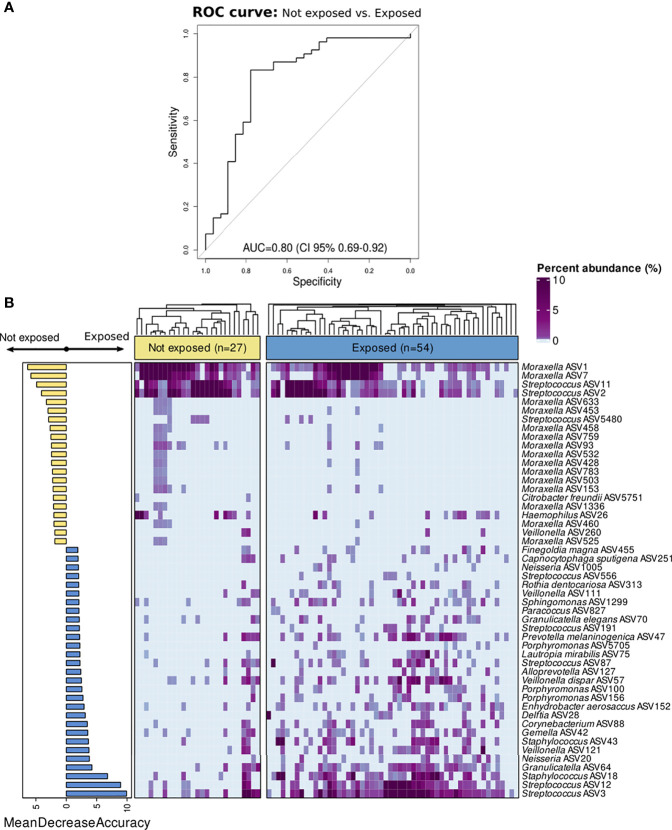
Figure 3.
Classification of children with IPD according to antibiotic-exposure using a Random Forest model based on nasopharyngeal microbiota composition. All ASVs as well as confounding factors (age, gender, seasonality, vaccination, ICU admission, and length of hospital stay) were included in the model. (A) ROC curve showing the performance of the RF model at the ASV level. (B) Bar plot showing top 50 most important features to class separation according to the Mean Decrease Accuracy score (confounding factors were not found among the top important features). Color-coding shows directionality of the association for each of the 50 top features to either the not exposed (yellow) or antibiotic-exposed (blue) group based on a post hoc analyses with Cliff’s delta estimation of the effect size. In addition, a heatmap displaying relative abundance (%) of these top 50 features across samples is shown on the right. Each column represents a sample, while each row represents a different feature. In the x-axis, samples are split by group and ordered according to hierarchical clustering using a Bray–Curtis dissimilarity measure.

