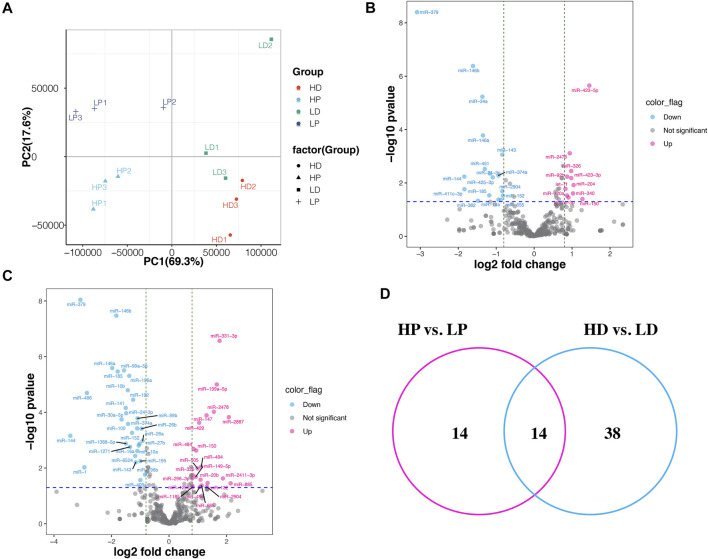
FIGURE 2.
Differentially expressed miRNAs between high and low milk protein percentage. (A) The principal component analysis (PCA) scatter plot of miRNA expression in the 12 samples. PCA plot showing variance of the three biological replicates of each of the groups. The percentages on each axis represent the percentages of variation explained by the principal components. (B) Volcano plot displaying differentially expressed miRNAs of HP vs. LP. The pink and blue dots represent the significantly upregulated and down-regulated miRNA; the gray dots represent miRNAs whose expression levels do not reach statistical significance. (C) Volcano plot displaying differentially expressed miRNAs of HD vs. LD. (D) Venn diagram depicting commonly and uniquely DE miRNAs detected by HP vs. LP and HD vs. LD.

