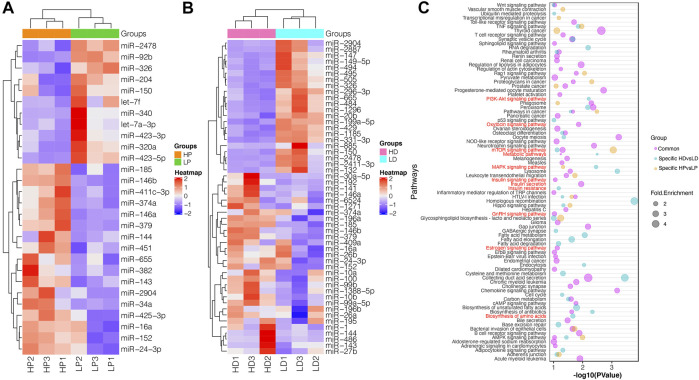
FIGURE 3.
The functional annotation of DE miRNAs. (A,B) Cluster analysis of DE miRNAs in HP vs. LP and HD vs. LD based on their standardized expression by z-score. Red indicates higher expression and blue shows lower expression. (C) Predominant function categories targeted by common DE miRNAs, lactation-specific DE miRNAs and non-lactating-specific DE miRNAs. More significant values and shapes were suggesting higher relevance and higher enriched fold, respectively. The red labels represent the milk protein-associated pathways.

