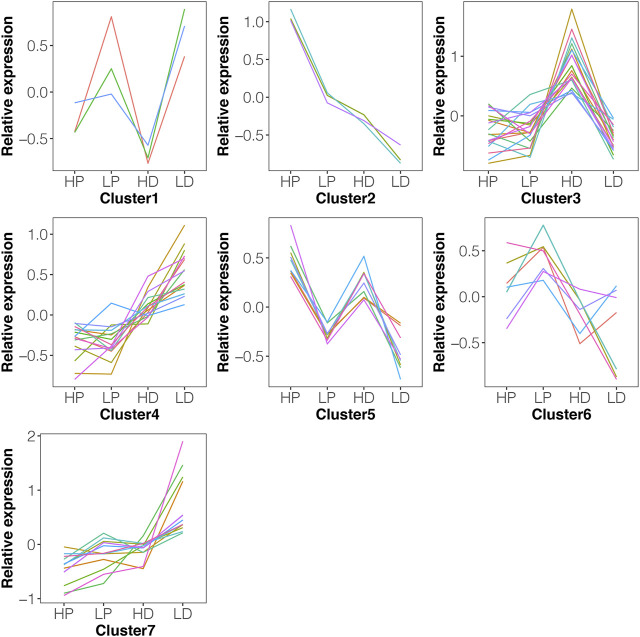
FIGURE 4.
The expression pattern of DE miRNAs using k-means clustering. The 66 DE miRNAs in either HP vs. LP or HD vs. LD could be divided into seven distinct clusters with differentially expression level pattern changes. The y-axis represents the relative expression using mean normalization. Most clusters (such as clusters 1, 2, 5 and 7) revealed that the expression change pattern of miRNAs in HP vs. LP was similar to HD vs. LD.

