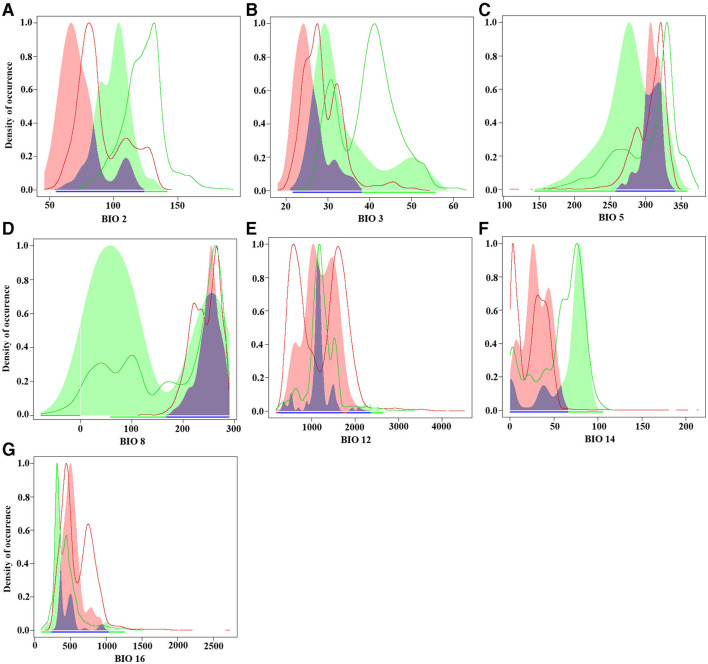
Figure 4.
Predicted niche occupancy (PNO) profiles. Blue indicates niche overlap, green represents the origin country, and red represents the invasion country. (A) Mean diurnal range (Bio2); (B) isothermality (Bio3); (C) max temperature of the warmest month (Bio5); (D) mean temperature of the wettest quarter (Bio8); (E) annual precipitation (Bio12); (F) precipitation of the driest month (Bio14); (G) precipitation of the wettest quarter (Bio16).

