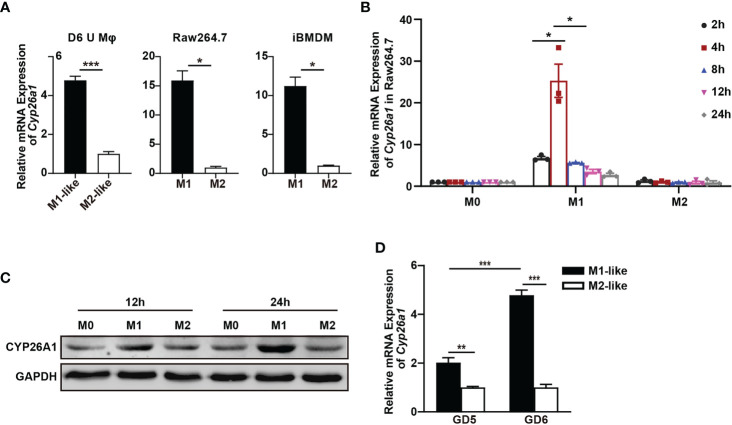
Figure 2.
Differential expression of Cyp26a1 in M1 and M2 macrophages. (A) qPCR analysis of Cyp26a1 in M1 and M2 of GD6 uterine macrophages (D6 U Mφ), Raw264.7 and iBMDM (n=3). (B) qPCR analysis of Cyp26a1 in M0, M1 and M2 macrophages of Raw264.7 at different induction time (LPS (100 ng/mL) + IFN-γ(20 ng/mL); 2 h, 4 h, 8 h, 12 h and 24 h; n=3). (C) Protein expression of CYP26A1 in M0, M1, M2 macrophages of Raw264.7 at different induction time (12 h and 24 h) was analyzed by Western blot. GAPDH was used as loading control. (D) qPCR analysis of Cyp26a1 in M1-like and M2-like uterine macrophages of GD5 and GD6 (n=3). Error bars represent means ± SEM; two-tailed unpaired t-test, ns, not significant, *P < 0.05, **P < 0.01, or ***P < 0.001.

