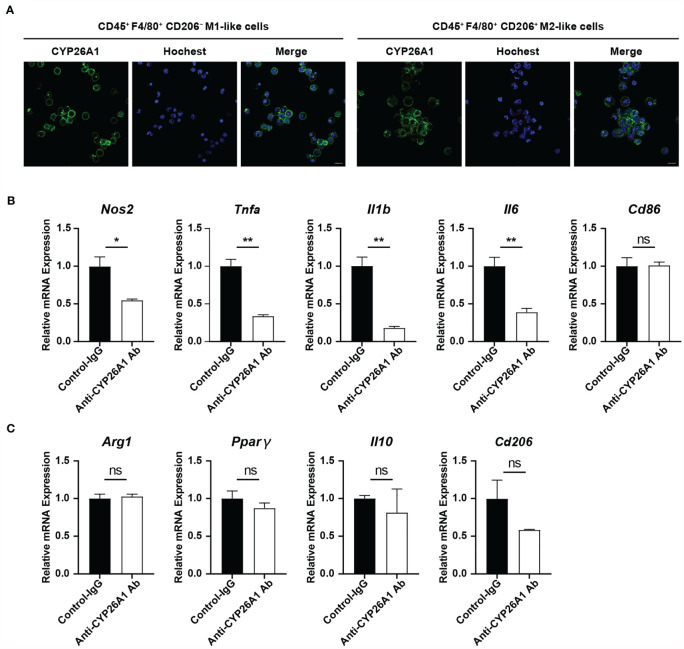
Figure 4.
The effect of inhibiting the activity of CYP26A1 on the polarization level of uterine macrophages. (A) Live cells immunofluorescence analysis CYP26A1 expression in M1-like and M2-like macrophages isolated from the uterus on GD6 mice. Scale bar, 10 µm. (B) qPCR analysis of M1 markers (Nos2, Tnfa, Il1b and Il6) on uterine macrophages treated with anti-CYP26A1 Ab or control IgG for 12 h and then induced with LPS and IFN-γ for 4 h (n=3). (C) qPCR analysis of M2 markers (Arg1, Pparg, Il10 and Cd206) on uterine macrophages treated with anti-CYP26A1 Ab or control IgG for 12 h and then induced with IL-4 and IL-13 for 4 h (n=3). Error bars represent means ± SEM; two-tailed unpaired t-test, ns, not significant, *P < 0.05 or **P < 0.01.

