Figure 6.
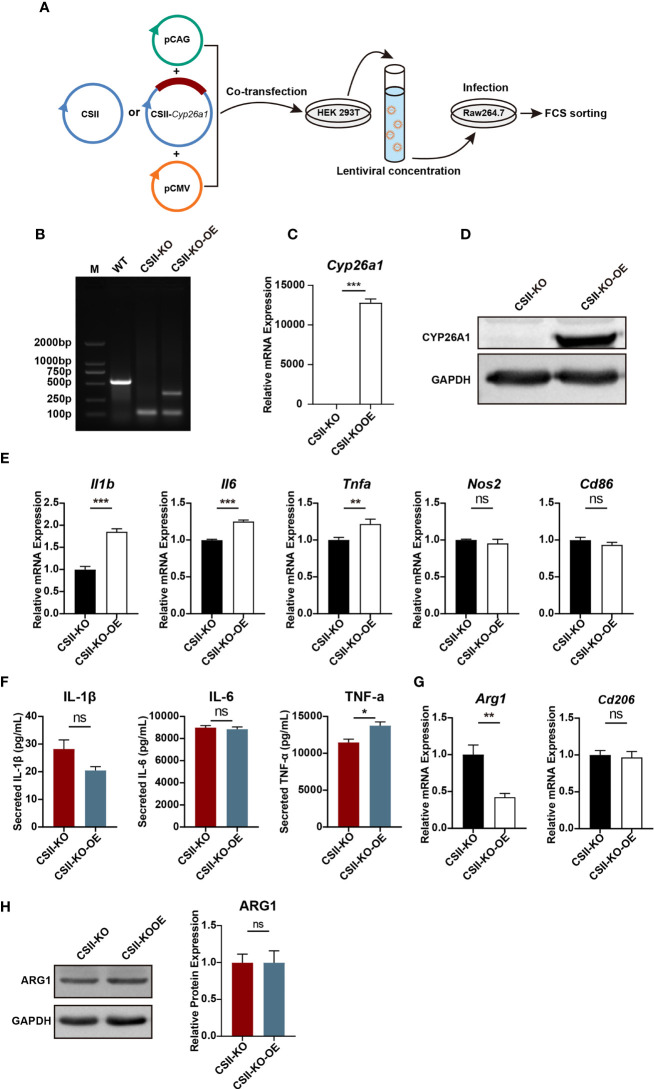
Re-introduction of CYP26A1 partially reversed the polarization levels of M1 in CYP26A1−/− Raw264.7 cells. (A) Schematic diagram of CYP26A1 overexpression in CYP26A1−/− Raw264.7 cells with the lentiviral expression vector. (B–D) Genomic PCR, qPCR and Western blot were used to identify CYP26A1 overexpression cells. PCR products, WT: 526bp; KO: 99bp; KO-OE: 99bp, 334bp. (E) qPCR analysis of M1 phenotype genes Il1b, Il6, Tnfa, Nos2 and Cd86 in CSII-KO and CSII-KO-OE cells after induced 4 h by LPS and IFN-γ (n=3). (F) ELISA was used to measure IL-1β, IL-6 and TNF-α secretion in supernatants of Raw264.7 cells (CSII-KO and CSII-KO-OE) treated with LPS and IFN-γ for 24 h (n=3). (G) qPCR analysis of M2 markers Arg1 and Cd206 in Raw264.7 cells (CSII-KO and CSII-KO-OE) after induced 4 h by IL-4 and IL-13 (n=3). (H) Western blot analysis of M2 markers ARG1 in CSII-KO and CSII-KO-OE cells after induced 24 h by IL-4 and IL-13 (n=3). GAPDH was used as loading control. Error bars represent means ± SEM; two-tailed unpaired t-test, ns, not significant, *P < 0.05, **P < 0.01, or ***P < 0.001.

