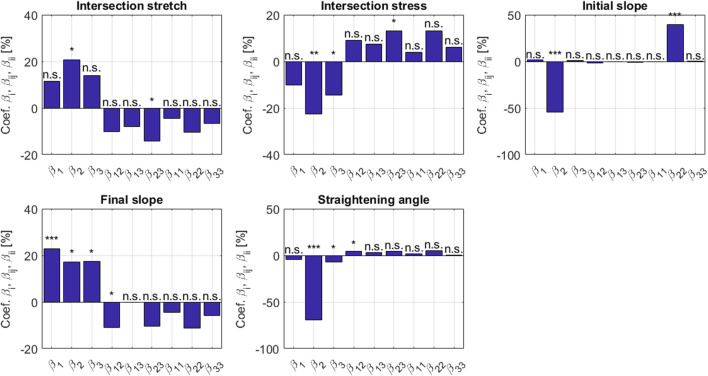
FIGURE 6.
Sensitivity coefficients β i , β ij , β ii according to Eqs 47, 48, with the indices 1, 2, and 3 relating to modulus, crimping angle, and volume fraction, respectively; determined for five metrics Y associated with the uniaxial stress-stretch behavior on the level of the tendinous tissue. The stars denote the significance level of the coefficients: three (resp. two and one) stars for a p-value below 10–3 (resp. 10–2 and 0.05); n.s. stands for non significant.

