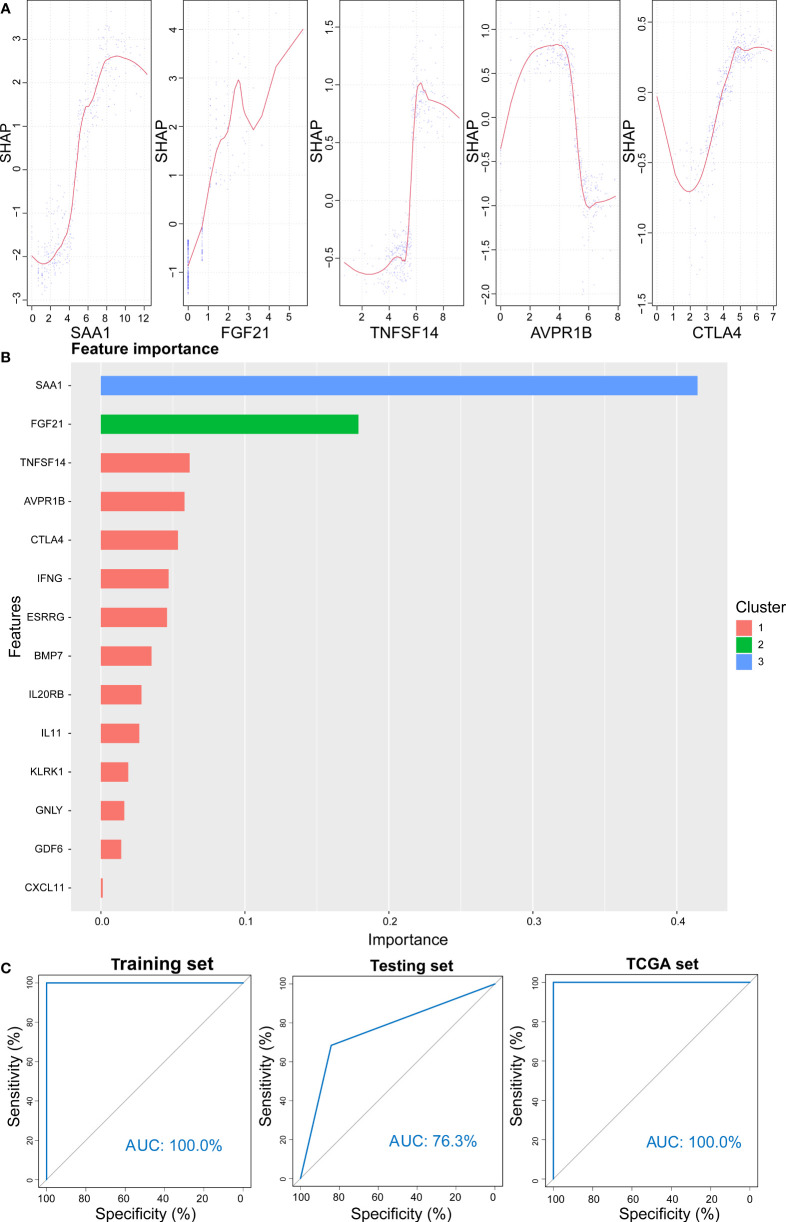
Figure 13.
Prediction results from the XGBoost algorithm. (A) SHAP contribution dependency plots for the training cohort. (B) Importance of 14 features of the training cohort. (C) ROC curve for XGBoost algorithm for the prediction of high- and low-risk patients in training, testing, and entire cohorts.

