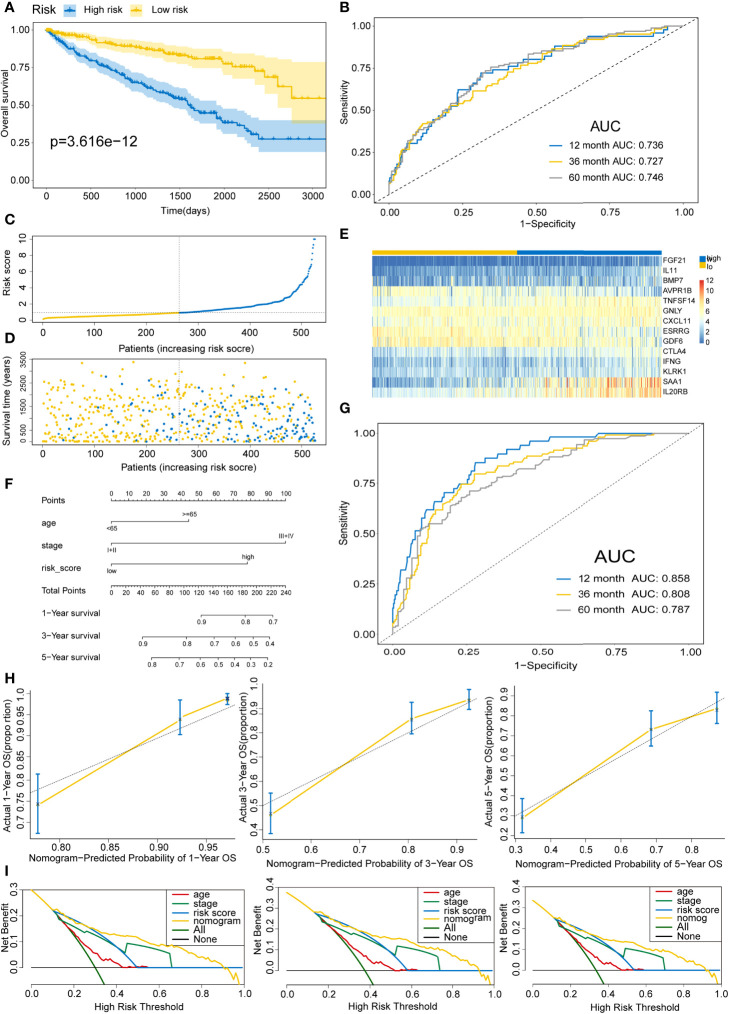
Figure 6.
Validating the immune risk score prognostic predictive model for the entire set. (A) Kaplan–Meier curves of the OS outcomes in the entire cohort divided as high- and low-risk score groups. (B) Time-dependent ROC curves for prediction of 1-, 3-, and 5-year survival outcomes using this signature. (C) Risk score distributions for the entire cohort. (D) Vital statuses for high- and low-risk group patients. (E) Expression patterns for 14 immune-associated genes in the high- and low-risk score cohorts. (F) Nomogram for the prediction of the probability of 1-, 3-, and 5-year OS outcomes in the entire cohort. Risk scores and other independent prognostic factors were incorporated into the model. (G) Time-dependent ROC curves for prediction of 1-, 3-, and 5-year survival outcomes using the nomogram. (H) Calibration plot of nomogram in the training cohort according to the agreement between observed and predicted 1-, 3-, and 5-year outcomes. The models’ ideal performance is shown by the dashed lines. (I) Decision curve analysis for 1-, 3-, and 5-year risks using the nomogram. Black line represents the hypothesis that no patient died after 1-, 3-, and 5-years.

