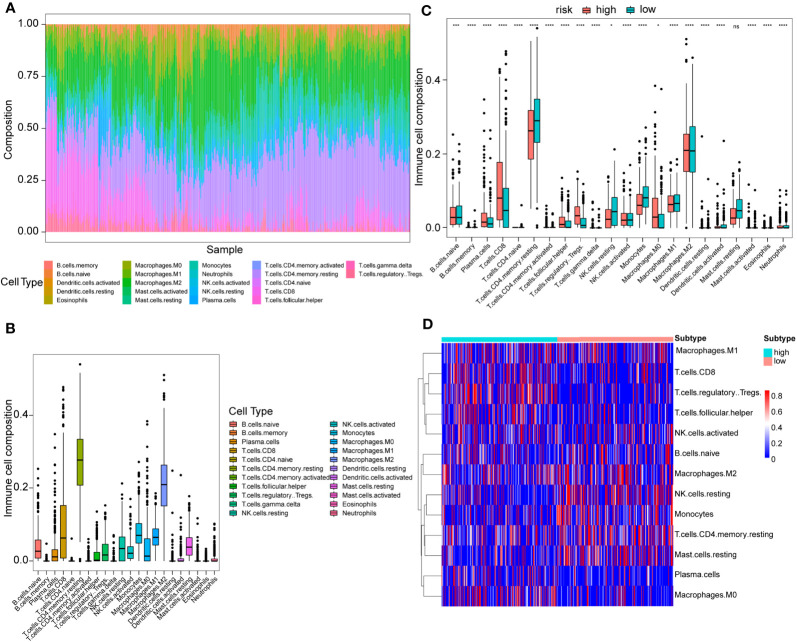
Figure 7.
Immune cell proportion analyses in the TCGA cohort between high- and low-risk score patients. (A) Overall view of relative proportions of immune cell infiltrations for 22 immune signatures. (B) Boxplots for 22 immune cell proportions in the TCGA cohort. (C) Boxplots for different immune cell infiltrations in the high- and low-risk score patients. Significance: ns≥0.05, ∗<0.05, ∗∗∗<0.001, and ∗∗∗∗<0.0001. (D) Immune cell heatmap for patients in the high- and low-risk score subtypes. Only immune cells whose non-zero proportions exceeded half in all samples were plotted.

