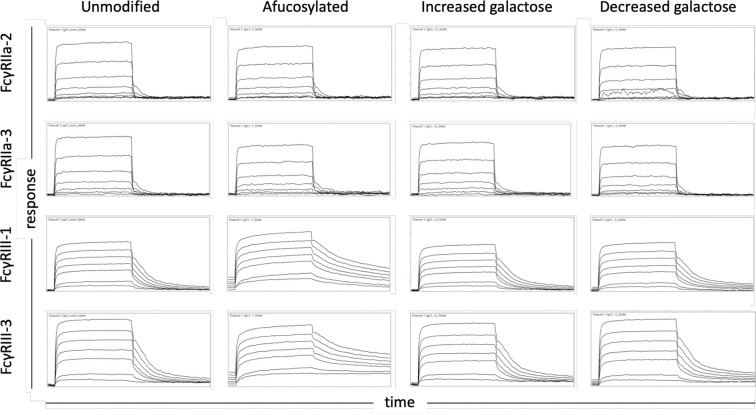
Figure 1.
Exemplary sensor data of FcγR-IgG interactions. Sensorgams depicting the association and dissociation of FcγR from IgG over time for prevalent FcγRII (2 and 3) and FcγRIII (1 and 3) allotypes (rows) and differentially glycosylated IgG (columns). The equilibrium dissociation constants reported in this work were calculated using the response measured at the end of the association phase when interactions had achieved steady state. Each receptor was evaluated over a three order of magnitude concentration range.

