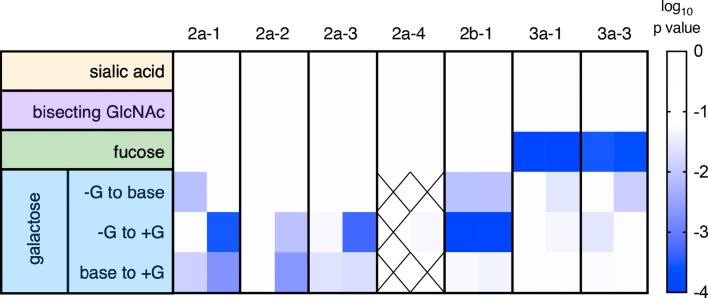
Figure 3.
Summary of receptor affinity differences. Statistical significance of differences in affinity associated with variable glycosylation. Glycan modifications are tabulated by row and receptors by column, for each of the two independent experimental runs. Confidence in differences is indicated in color. Crosshatches indicate missing data. The effect of varying (+ versus -) sialic acid, bisecting GlcNAc, and fucose were evaluated by unpaired t test, and for galactose [+G, unmodified (base), and -G] with an ordinary one-way ANOVA corrected for multiple comparisons.

