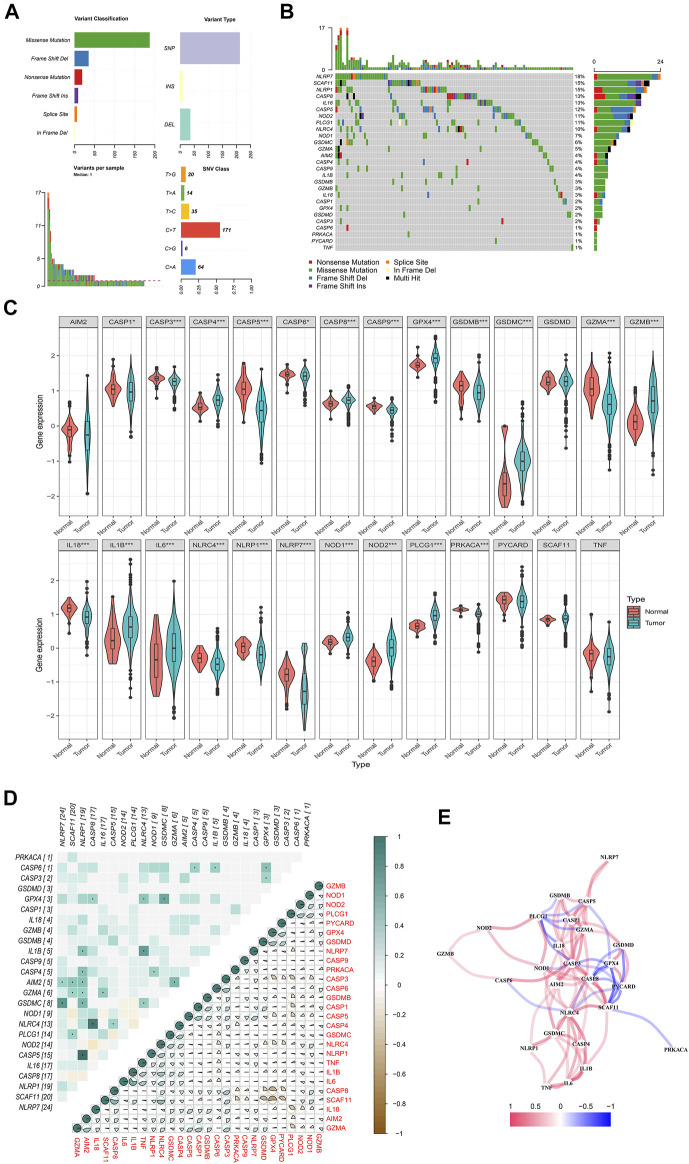
FIGURE 1.
Landscape of genetic and expression variation of pyroptosis-related regulators in colon cancer. (A, B) The mutation frequency and classification of 27 pyroptosis-related regulators in colon cancer based on The Cancer Genome Atlas—Colon Adenocarcinoma (TCGA-COAD). (C) The expression of 27 pyroptosis-related regulators in colon cancer and normal tissues: tumor, blue; and normal, red. The upper and lower ends of the boxes represent the interquartile range of values. The lines in the boxes represent median value, and black dots show the outliers. The asterisks represent the statistical p-value. Mann–Whitney U test. *p < 0.05; **p < 0.01; ***p < 0.001; p ≥ 0.05, not significant. (D) Heatmap showing the correlation of genetic variation and expression variations of pyroptosis-related regulators. Left: genetic variation; right: expression variations. p < 0.05. (E) The correlation network of the pyroptosis-related genes (red line, positive correlation; blue line, negative correlation; the depth of the colors reflects the strength of the relevance).

