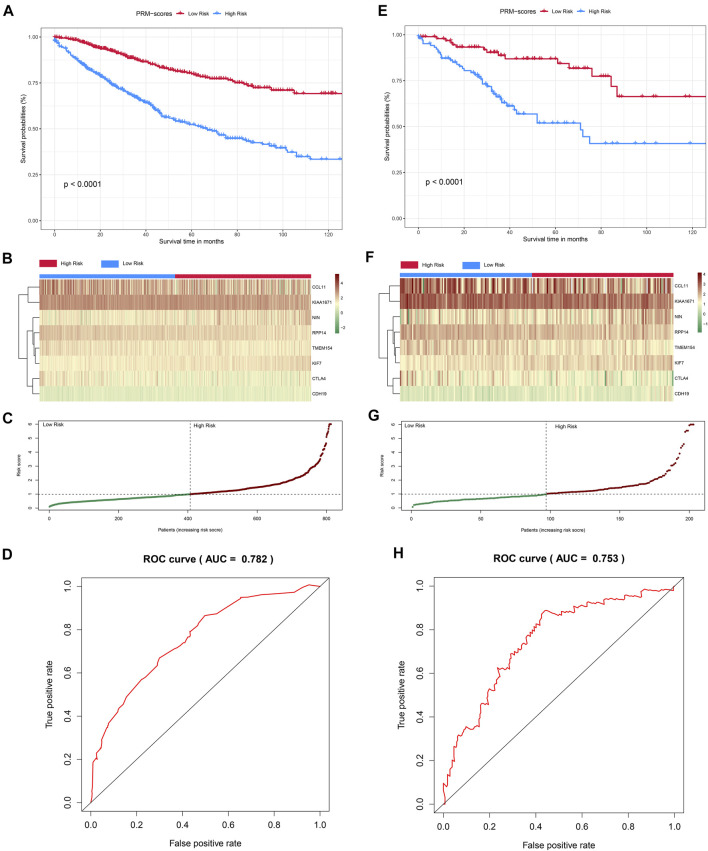
FIGURE 5.
Construction and validation of the PRM-scores in colon cancer cohorts. (A) Kaplan–Meier curves for the overall survival (OS) of colon patients in inner-training cohort between the high- and low-PRM-scores groups based on GSE39582, GSE33113, and The Cancer Genome Atlas—Colon Adenocarcinoma (TCGA-COAD) data (log-rank test, p < 0.01). (B, C) Distribution of PRM-scores and the expression of eight signatures related to three pyroptosis-related (PR) clusters in inner-training cohort. (D) receiver operating characteristic (ROC) curves demonstrated the predictive efficiency of the PRM-scores in inner-training cohort. (E) Kaplan–Meier curves for the OS of colon patients in validation cohort between the high- and low-PRM-scores groups (log-rank test, p < 0.01). (F, G) Distribution of PRM-scores and the expression of eight signatures related to three PR clusters in validation cohort. (H) ROC curves demonstrated the predictive efficiency of the PRM-scores in validation cohort.

