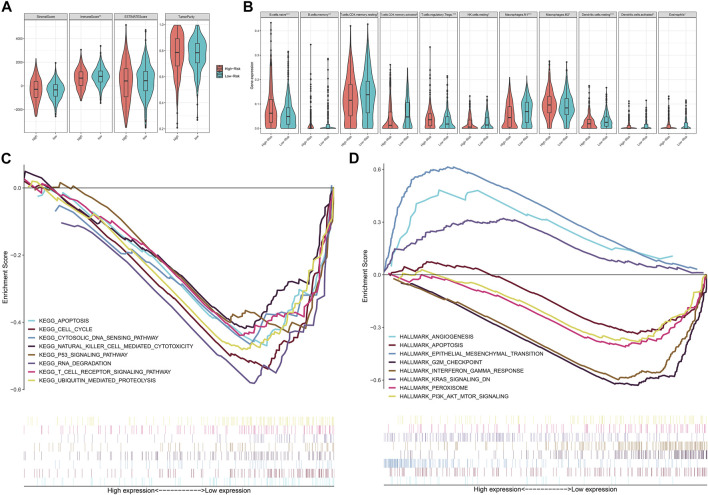
FIGURE 6.
Characteristics of the PRM-scores scoring model for colon cancer patients. (A) The level of stromalScores, immuneScores, ESTIMATEScores, and tumorPurity calculated with ESTIMATE in high- and low-PRM-scores groups. (B) The level of tumor microenvironment (TME) cell infiltration in high- and low-PRM-scores groups: high PRM-scores, red; and low PRM-scores, blue. The upper and lower ends of the boxes represent the interquartile range of values. The lines in the boxes represent median value, and black dots show outliers. The asterisks represent the statistical p-value. Mann–Whitney U test. *p < 0.05; **p < 0.01; ***p < 0.001; p ≥ 0.05, not significant. (C) The enriched gene sets in Kyoto Encyclopedia of Genes and Genomes (KEGG) by samples with high-risk sample. And only several leading gene sets are displayed in the plot. (D) Enriched gene sets in Hallmark collection by samples of high-risk sample. Only several leading gene sets are shown in the plot. Each line represents one particular gene set with unique color, and upregulated genes are located in the left approaching the origin of the coordinates; by contrast, the downregulated genes are on the right of the x-axis. Only gene sets with nominal (NOM) p < 0.05 and false discovery rate (FDR) q < 0.05 were considered significant. And only several leading gene sets are displayed in the plot.

