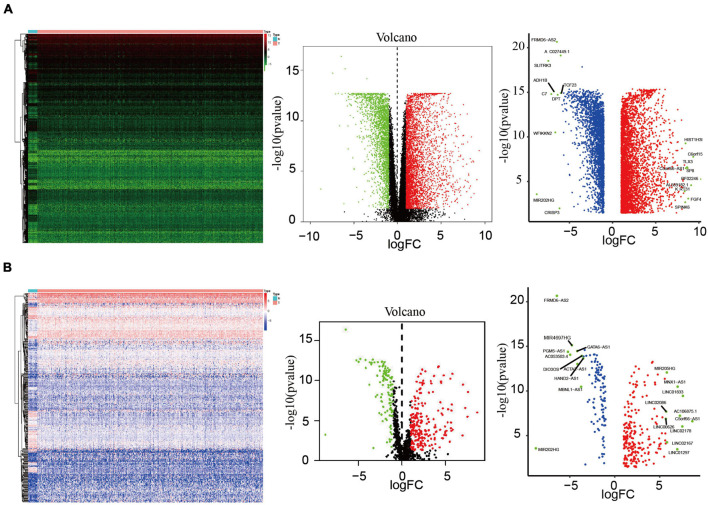
FIGURE 1.
Analysis of differentially expressed lncRNAs. (A) Heatmap and volcano map of 552 EC samples and 23 normal endometrium samples showing 3,860 upregulated molecules and 2,406 downregulated molecules (fold change >4, p = 0.001), and showed the most differentially expressed molecules. (B) Heatmap and volcano plots of 340 differentially expressed lncRNAs showing 228 upregulated and 112 downregulated, and showed the most differentially expressed molecules.

