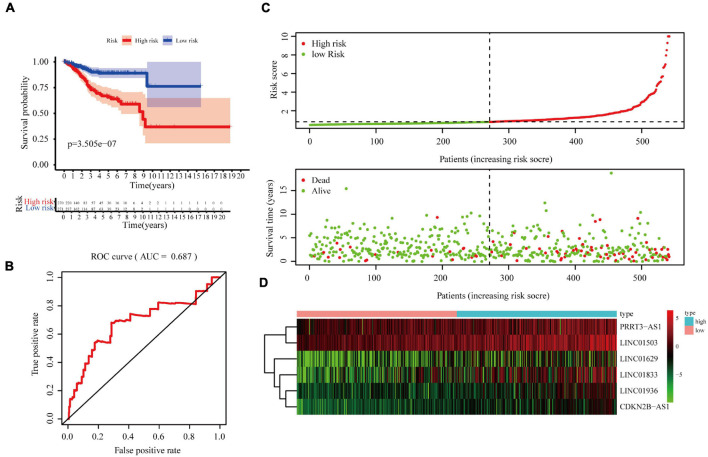
FIGURE 3.
Correlation between the six immune-related lncRNA signature and the OS and prognosis of patients with EC. (A) Kaplan–Meier OS curves for the high- and low-risk groups. (B) Risk curve of each sample reordered by risk score. (C) Scatter plot of OS. Green and red dots represent survival and death, respectively. (D) Heatmap showing the expression profiles of the signature in the low- and high-risk groups. The pink and blue bars represent the low-and high-risk groups, respectively.

