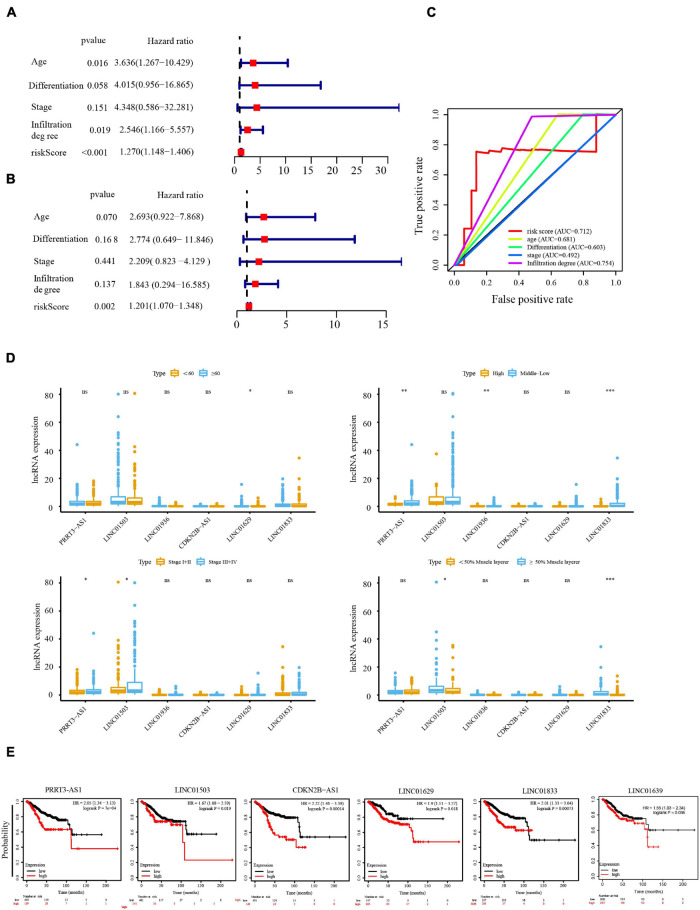
FIGURE 4.
Cox regression analysis of the independent prognostic value of the risk score. Univariate (A) and multivariate (B) Cox regression analysis of risk score, age, clinical stage, tumor differentiation, and depth of invasion. (C) The AUC of risk score, age, clinical stage, tumor differentiation, and depth of invasion was calculated from the total survival risk score according to the ROC curve. (D) Relationship between lncRNA expression and age, clinical stage, tumor differentiation, and depth of invasion. (E) Prognostic value of PRRT3-AS, LINC01503, CDKN2B-AS, LINC0162, LINC0183, and LINC01936 in UCEC analyzed using Kaplan–Meier (KM) Plotter. *P < 0.05, **P < 0.01, ***P < 0.001.

