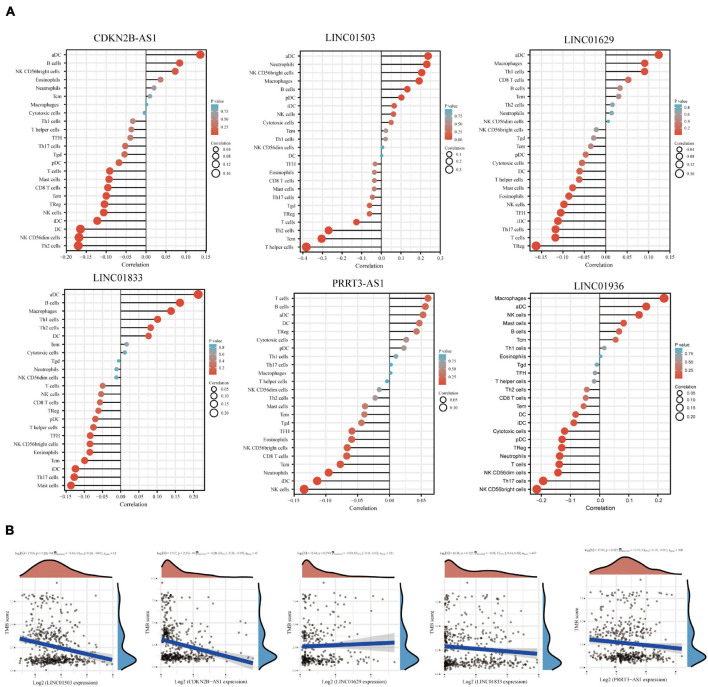
FIGURE 5.
Correlation between lncRNA expression and immune infiltration. (A) Correlation analysis of immune-related lncRNA expression and the infiltration of aDCs, B cells, CD8+ T cells, cytotoxic cells, DCs, eosinophils, iDCs, macrophages, mast cells, neutrophils, NK CD56bright cells, NK CD56dim cells, NK cells, pDCs, T cells, T helper cells, Tcm, Tem, Tfh, Tgd, Th1 cells, Th17 cells, Th2 cells, and Tregs. (B) Spearman correlation analysis of TMB/MSI and immune-related lncRNA expression. Horizontal axis represents gene expression distribution. Ordinate represents TMB/MSI score distribution. The density curve on the right represents the TMB/MSI score distribution trend. The upper density curve represents the gene expression distribution trend. The uppermost value represents the correlation p-value, correlation coefficient, and correlation calculation method. p-Values of <0.05 were considered significant. The correlation coefficient range was (–1, 1), with a negative number representing a negative correlation between the expression of two genes and a positive value representing a positive correlation. The closer to 1 or –1, the stronger the correlation. The closer to 0, the weaker the correlation.

