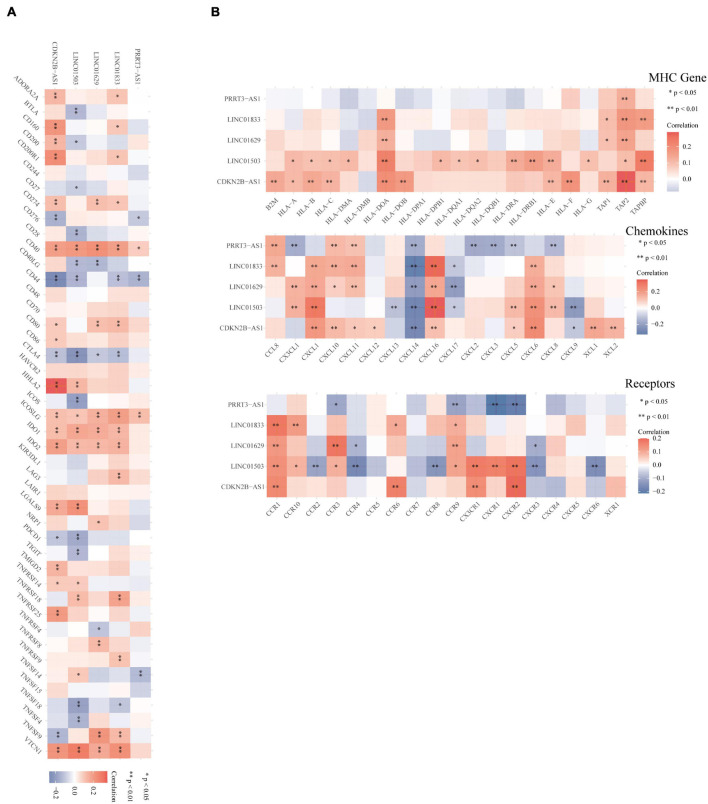
FIGURE 6.
Correlation between the immune-related lncRNA expression and immune factors. (A,B) Spearman’s correlation analysis between immune-related lncRNAs and immune checkpoints, MHC molecules, chemokines, and chemokine receptors. Different colors represent the correlation coefficient (red, positive; blue, negative). A darker color indicates a stronger correlation, ∗p < 0.05, ∗∗p < 0.01.

