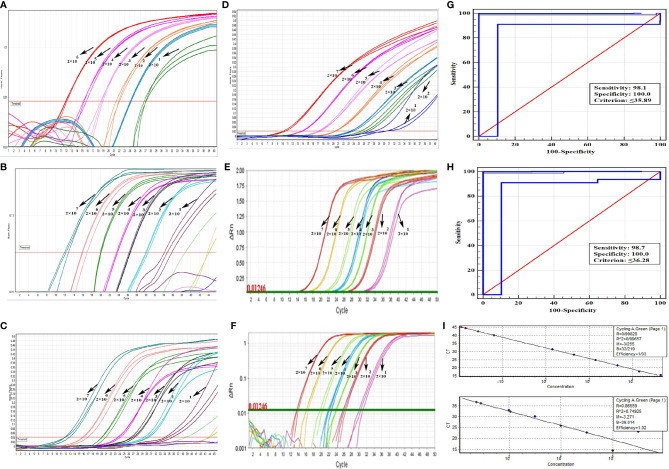
Figure 3.
Performance specifications of Leishmania detection with qPCR validation. Amplification plots derived from serial dilutions of cultured parasites, ranging from 20 to 2 × 10⁷ copies/rxn plasmids by qPCR. FAM fluorescent reporter dye of COII gene, compared to Cyt b (FAM fluorophore) in the reference kit was displayed. (A) Reportable range of Leishmania (20–2 × 10⁶). (B, C) Logarithmic and linearity amplification plots of detection limit of Leishmania (20–2 × 10⁷) using COII, respectively. (D) Linearity amplification plot of detection limit of Leishmania using Cyt b in reference kit. (E, F) Linearity and logarithmic amplification plot of quantification limit of reproducibility using StepOnePlus™ machine, respectively. Amplification curves are shown for each sample, with each parasite concentration depicted by different color. (G) Clinical sensitivity and specificity of Leishmania diagnostic by ROC analysis (sensitivity = 98.1, diagnostic CT = 35.89) using COII. (H) Clinical sensitivity and specificity of Leishmania with genesig® Leishmania Advanced diagnostic kit (sensitivity = 98.7, diagnostic CT = 36.28) using Cyt b (I) Standard quantification curves, the mean CT values are plotted from triplicates tested against prepared serial dilutions. Each point represents CT of an individual sample, with plot of CT values and parasite equivalent fitting a linear function (R2 = 0.996 for qPCR and, R2 = 0.749 for genesig® Leishmania Advanced kit) (See Table 2 ).

