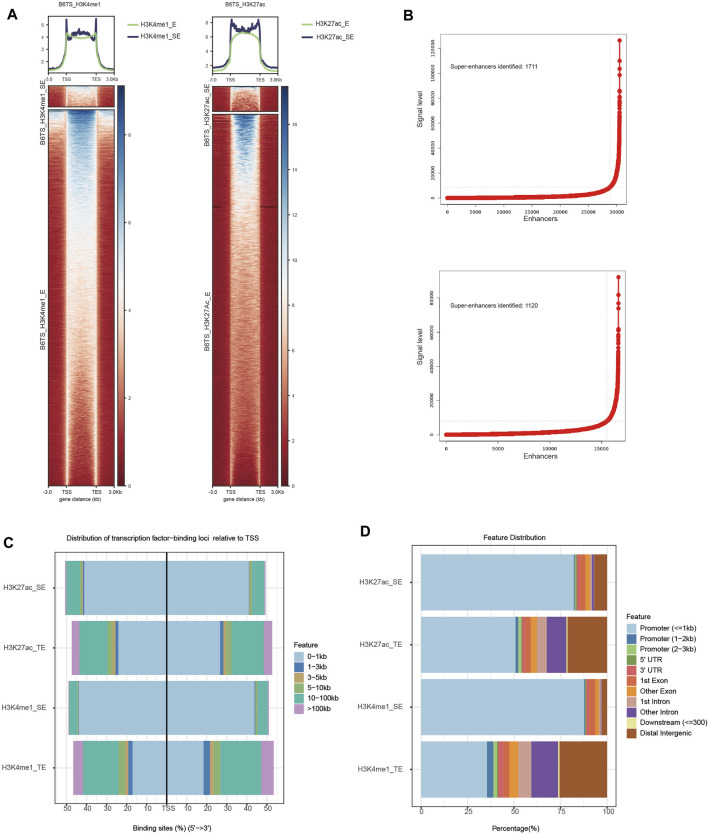
FIGURE 1.
Profiles of SEs in TSCs (B6TS). (A) Heatmaps showing the average signal levels of H3K27ac and H3K4me1 SEs and TEs in TSCs (B6TS). (B) Identification of SEs. Enhancers within 12.5 kb were stitched together and ranked by the level of the H3K27ac and H3K4me1 signals. Enhancers with an H3K27ac signal above a cutoff of a slope of 1 on the curve were considered SEs. (C) Distribution of SEs and TEs throughout the genome (transcription factor-binding loci relative to TSS). (D) Distribution of SEs and TEs throughout the genome (distribution features).

