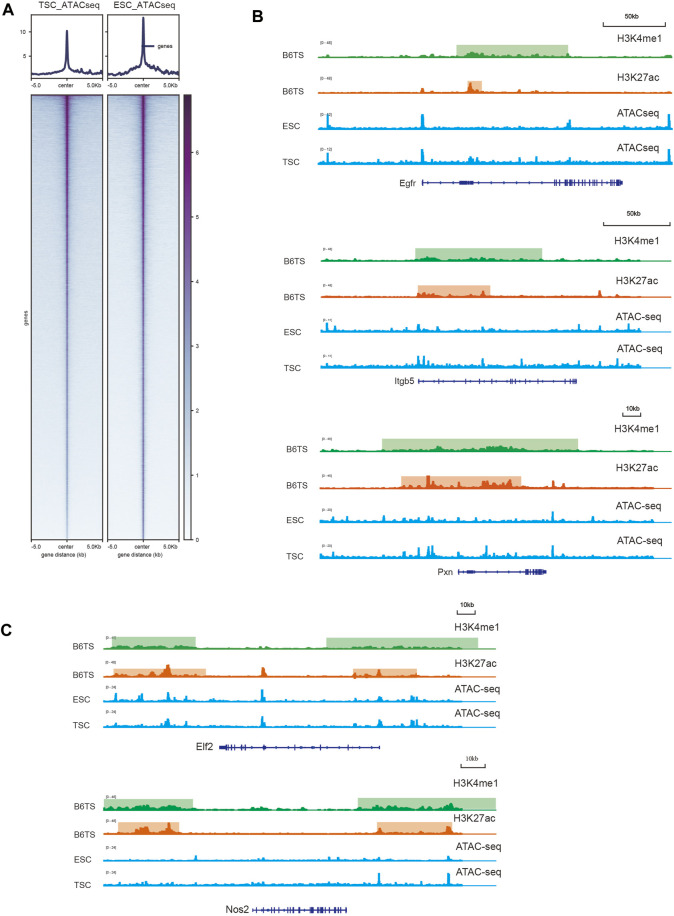
FIGURE 6.
Evaluation of the chromatin accessibility of key cell identity genes. (A) Heatmaps showing the general signal levels identified by ATAC-seq in ESCs and TSCs. (B) H3K27ac and H3K4me1 signals of TSCs (B6TS) and ATAC-seq signals of ESCs and TSCs at Egfr, Itgb5, Pxn. (C) H3K27ac and H3K4me1 signals of TSCs (B6TS) and ATAC-seq signals of ESCs and TSCs at Elf2 and Nos2.

