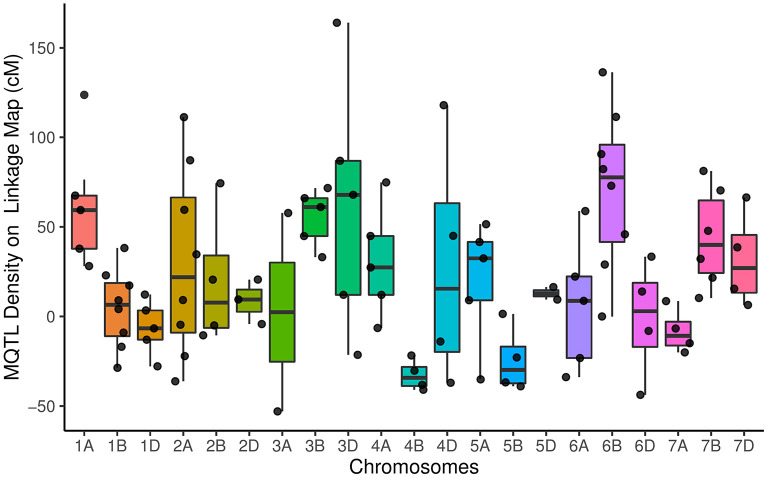
Figure 2.
Distribution of meta-quantitative trait loci (MQTLs) for assessed traits on all chromosomes represented as a number of MQTLs per distance (50 cM), starting from the centromeric region of each chromosome where it was considered at position 0 cM. Each dot represents the exact location of each MQTL.

