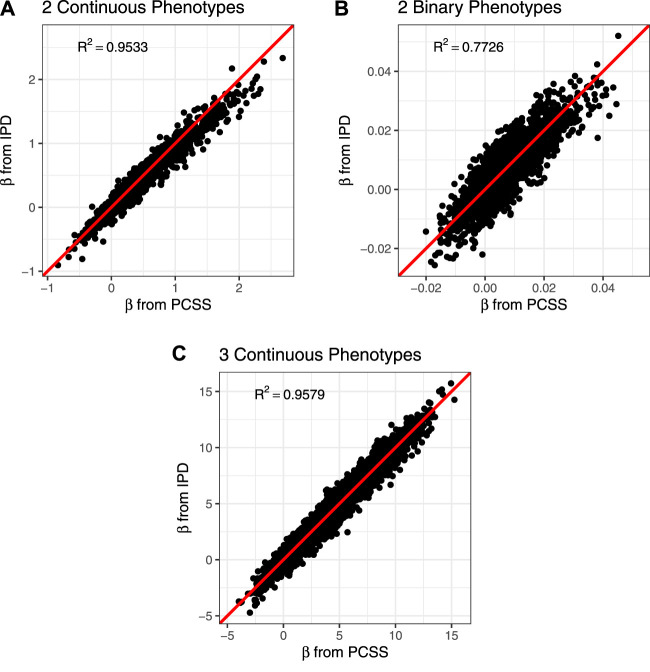
FIGURE 2.
Comparison of slope coefficients from a simulation study approximating a covariate adjusted linear model for a product of phenotypes using pre-computed summary statistics (PCSS) and individual participant data (IPD). (A) Modeling the product of two continuous phenotypes while adjusting for a binary and a continuous covariate. (B) Modeling the product of two binary phenotypes while adjusting for a binary and a continuous covariate. (C) Modeling the product of three continuous phenotypes while adjusting for a binary covariate.

