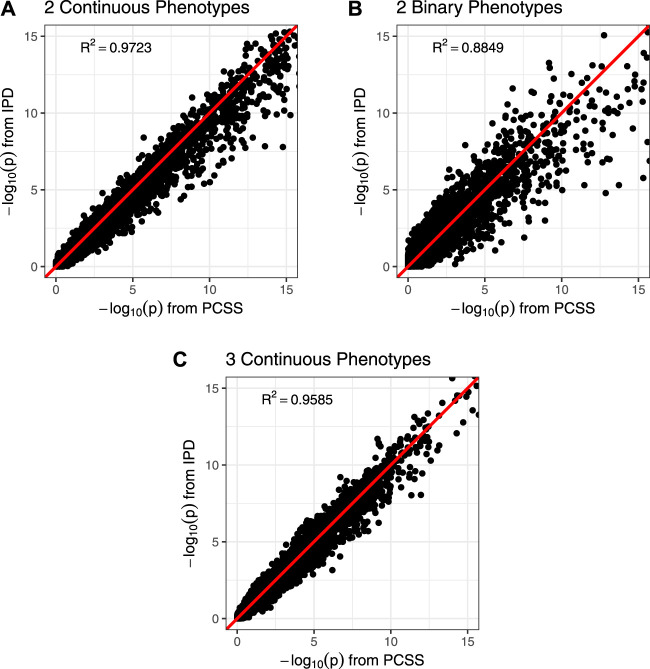
FIGURE 3.
Comparison of p-values from a simulation study approximating a covariate adjusted linear model for a product of phenotypes using pre-computed summary statistics (PCSS) and individual participant data (IPD). Two-sided p-values were computed for the null hypothesis that the SNP had no linear effect on the phenotype product while adjusting for covariates. All plots are restricted to the range (0, 15); unrestricted plots are available in the supplementary materials. (A) Modeling the product of two continuous phenotypes while adjusting for a binary and a continuous covariate. (B) Modeling the product of two binary phenotypes while adjusting for a binary and a continuous covariate. (C) Modeling the product of three continuous phenotypes while adjusting for a binary covariate.

