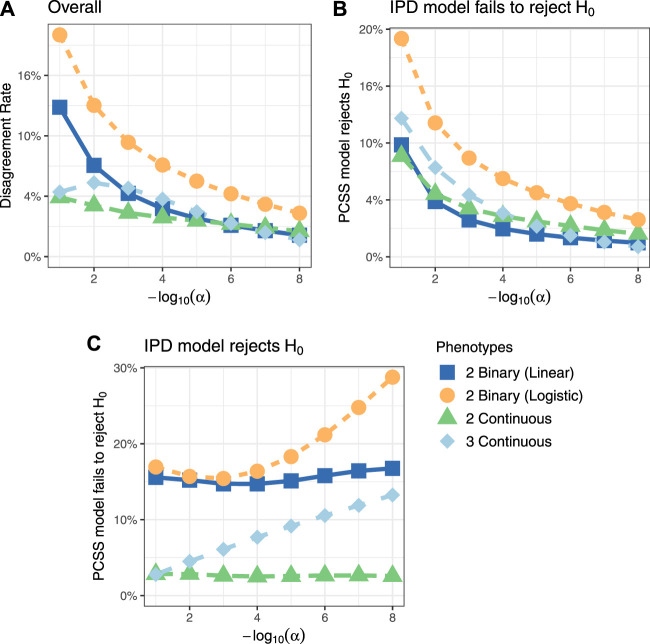
FIGURE 4.
Simulation studies’ test decision disagreement rates evaluating the significance of a SNP in a linear model for a product of phenotypes while adjusting for covariates using individualized participant data (IPD) and pre-computed summary statistics (PCSS) at various significance thresholds (α). Comparisons were also made between a logistic regression model fit using IPD on the product of two binary phenotypes and the PCSS model approximating the linear relationship. (A) Percentage of times the PCSS and IPD models’ test decisions disagreed across all simulations. (B) Percentage of times the PCSS model rejected the null hypothesis given that the IPD model failed to reject the null hypothesis. (C) Percentage of times the PCSS model failed to reject the null hypothesis given that the IPD model rejected the null hypothesis.

