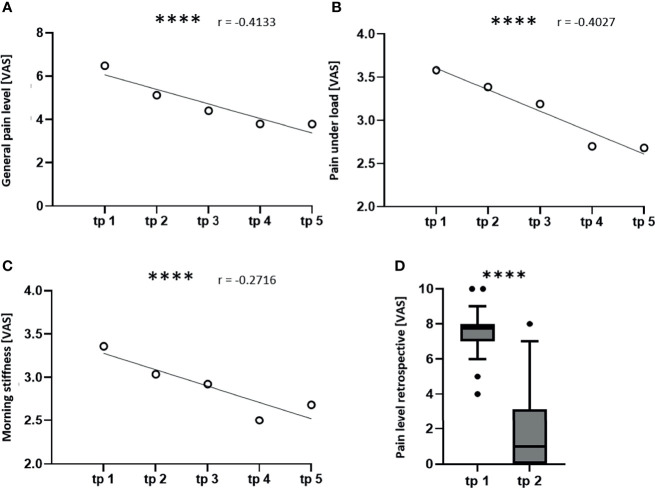
Figure 3.
LDRT induces a significant pain reduction. The patients scored their pain level on a visual analogue scale (VAS) ranging from 0 (no pain) to 10 (worst pain imaginable) at the indicated time points (tp). A Spearman correlation and a simple linear regression were performed in order to correlate the pain levels of all patients to the time points (A–C). For the graphical illustration, the mean values of the pain levels were calculated for all five tp. (A) shows the correlation of the mean general pain level, (B) shows the correlation of the pain under load and (C) shows the correlation of the morning stiffness to the study tp (n = 100; ****p < 0.0001). (D) shows a box plot for the retrospective determination of the pain level before therapy and at least six months after therapy. A Wilcoxon test was used for the statistical analysis in graph (D) (n = 125; ****p < 0.0001).

