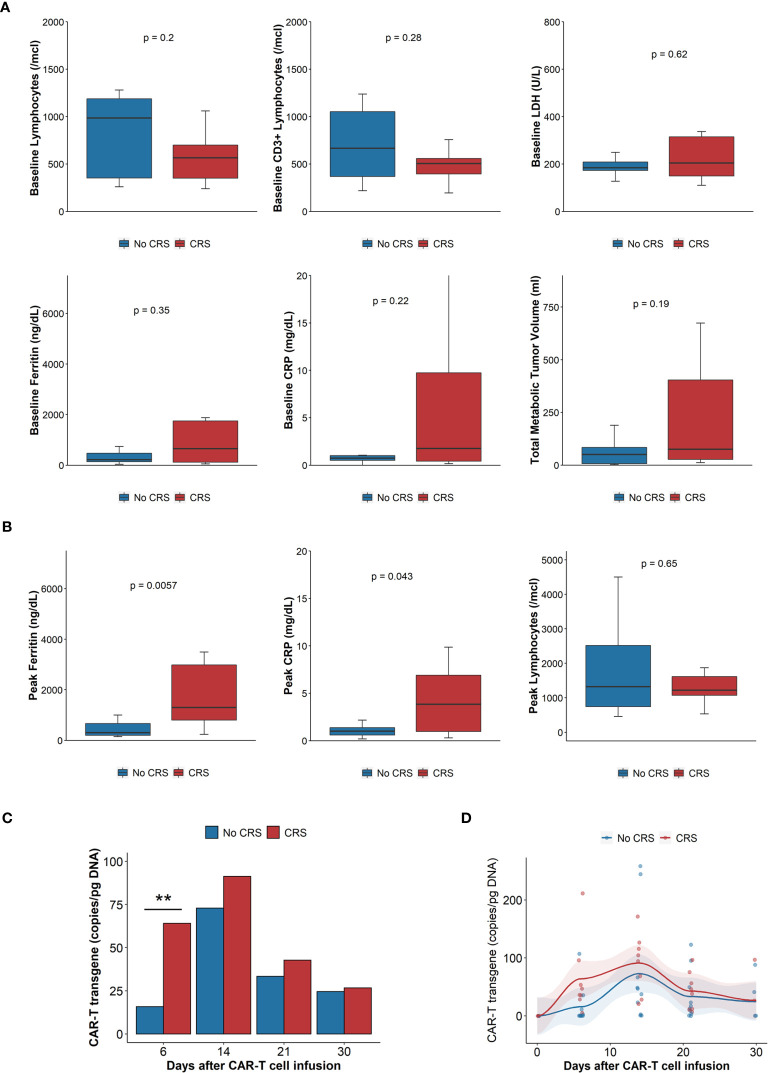
Figure 1.
Laboratory parameters, tumor burden and CAR-T cell expansion. (A) Baseline laboratory parameters (n = 20): clockwise: absolute lymphocyte count, CD3+ lymphocytes, LDH, total metabolic tumor volume, CRP, ferritin. Comparisons done with Wilcoxon rank sum test. (B) Peak laboratory parameters: Ferritin, CRP, absolute lymphocyte count. Blue boxes, bars, dots and lines represent results of patients without CRS, red boxes, bars, dots and lines those with CRS. CRP: C reactive protein; CRS: cytokine release syndrome; LDH: Lactate dehydrogenase. Comparisons done with Wilcoxon rank sum test. (C) Mean CAR-T transgene expansion, measured by qPCR, 6, 14, 21 and 30 days after infusion. N = 13. Comparisons done with Wilcoxon rank sum test. **p < 0.01. (D) Scatterplot of CAR-T expansion measured by qPCR, trends generated by locally estimated scatterplot smoothing (loess), AUC of CAR-T transgene (copy/pg DNA x days), n = 13, compared with Wilcoxon rank sum test, p = 0.16. Blue boxes, bars, dots and lines represent results of patients without CRS, red boxes, bars, dots and lines those with CRS. AUC, Area under the curve; CRP, C reactive protein; CRS, cytokine release syndrome; LDH, Lactate dehydrogenase qPCR, quantitative polymerase chain reaction.

