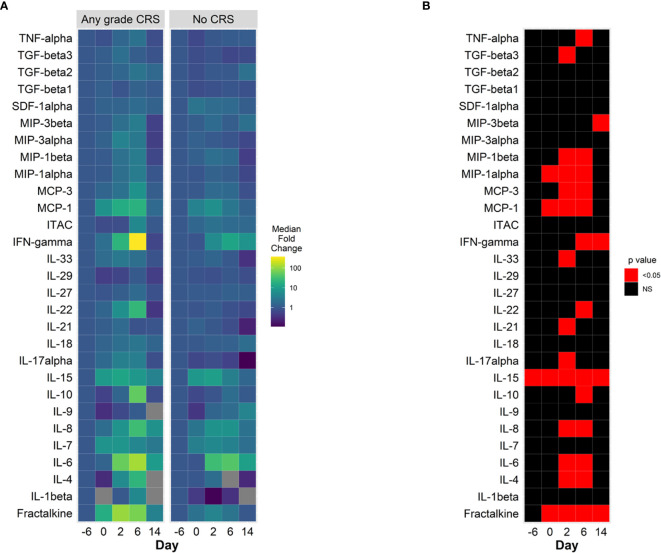
Figure 2.
Cytokine changes in CAR-T cell patients treated with prophylactic tocilizumab, (n = 13). (A) Median fold change from baseline (pre-lymphodepletion) over time in plasma cytokine concentrations in patients with CRS (left panel) and without CRS (right panel). Days are represented on the horizontal axis. Larger increases from baseline are shown in the green – yellow spectrum. Gray tiles represent missing values. (B) Comparisons of mean plasma cytokine concentrations of patients with CRS and without CRS (Wilcoxon test). Red tiles denote p values < 0.05. Not significant values (NS) are noted with black tiles.

